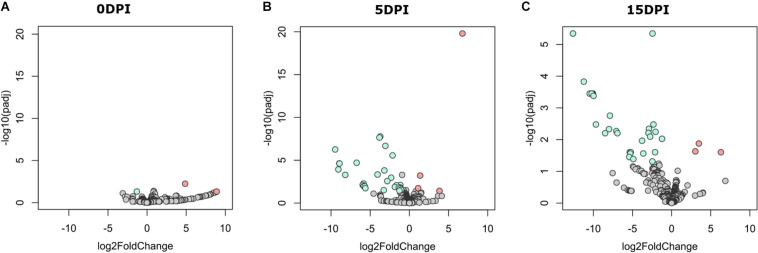
FIGURE 5.
Differential functional profile of goat kid microbiome from uninfected and Cryptosporidium parvum-infected goats. Volcano plot showing differential abundant pathways between infected and uninfected animals detected by DESeq2 analysis at (A) 0 dpi, (B) 5 dpi, and (C) 15 dpi. The green and the red dots indicate pathways that display both large-magnitude log fold-changes and negative log-10 transform of the adjusted P-value (Benjamini–Hochberg false discovery rate method); the gray dots are not significant (Padj < 0.05). Detailed information on pathway identity and differentiation is presented in Supplementary Table 3.

