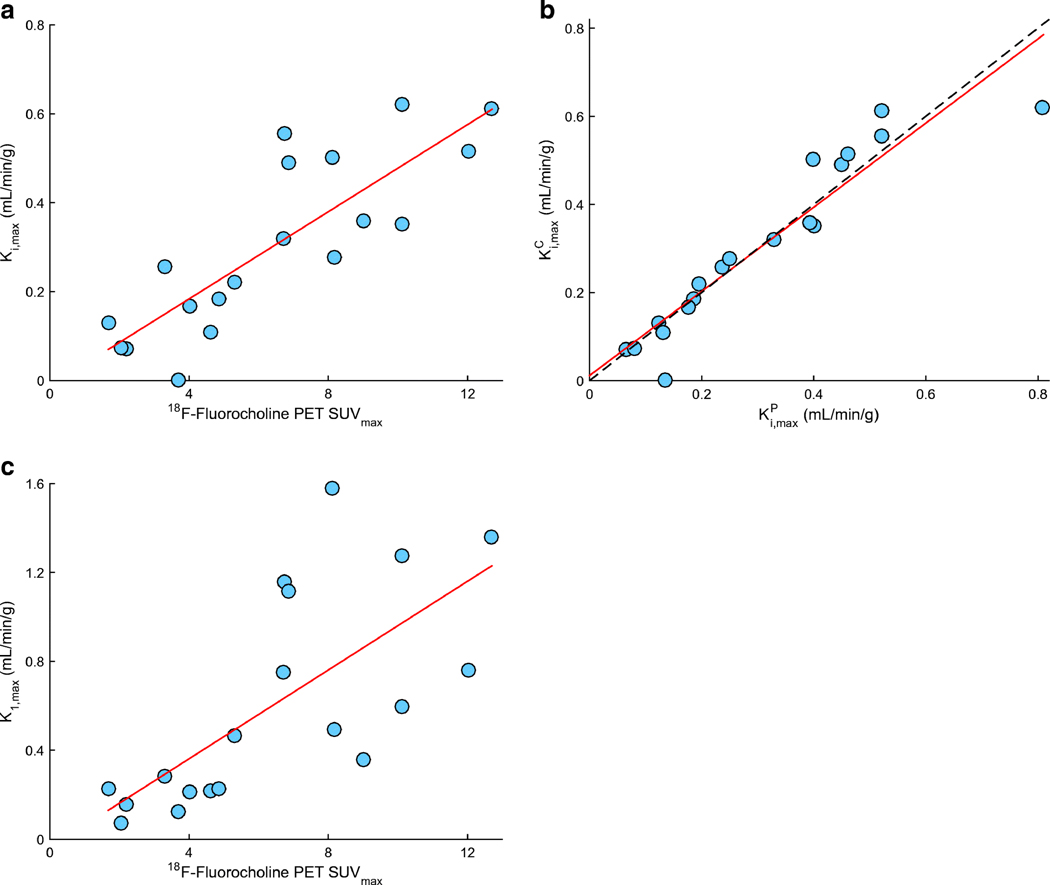
Figure 2.
Correlation between investigated 18F-Fluorocholine PET imaging metrics in n=19 lesions for which pharmacokinetic modeling was performed. Regions of interest were focused on the are with highest uptake of 18F-Fluorocholine. (A) PET SUVmax vs Ki,maxC; Spearman’s r = 0.83 (p<0.01). (B) PET SUVmax vs K1; r = 0.70 (p<0.01). (C) KiP vs KiC, with superimposed identity (dashed grey) and regression (solid red) lines; r = 0.94 (p<0.01).

