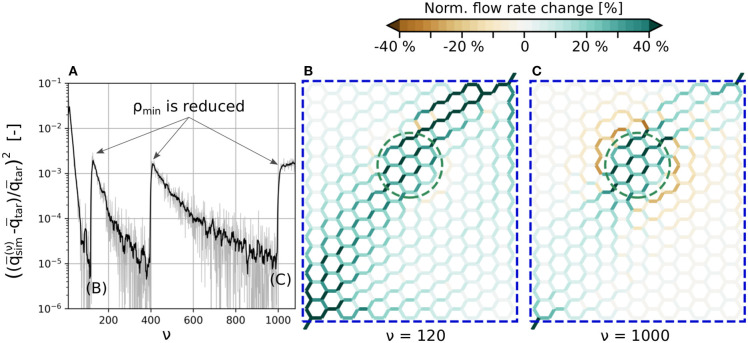
Figure 2.
Convergence of the cost function and computed flow rate changes with/without secondary constraints. (A) Instantaneous and filtered convergence of primary constraints of J. (B) Flow rate changes at ν = 120 without secondary constraints. (C) Flow rate changes for the final result with the minimum ρmin at ν = 1, 000. The average flow rate is increased by 30% in the edges encircled by the green dashed line. All edges within the blue dashed line are allowed to change their diameters to up-regulate flow. The absolute flow rate changes are normalized with the mean baseline flow rate in the activated region, i.e., . For more information on how the normalized flow rate changes were calculated, and for a visualization of the absolute flow distributions at ν = 0, ν = 120 and ν = 1, 000, see Figure S4.

