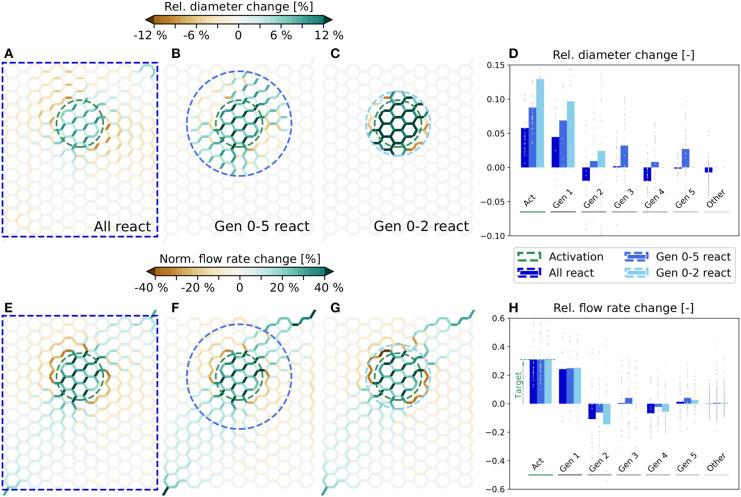
Figure 4.
Diameter and flow rate changes for different scenarios in artificial networks. Relative diameter changes of individual vessels for the scenarios where all (A), Gen 0-5 (B) and Gen 0-2 (C) vessels can react. In each scenario, the blood vessels within the blue dashed lines can adapt. The average flow rate is increased by 30% in the edges within the green dashed circle. (D) Relative diameter changes as a function of the vessel generation. Gray dots represent relative changes in individual blood vessels and bars the mean change for each generation. Flow rate changes in individual vessels for the scenarios where all (E), Gen 0-5 (F) and Gen 0-2 (G) vessels can react. The absolute flow rate changes are normalized with the mean baseline flow rate in the activated region, i.e., . (H) Relative flow rate changes as a function of the vessel generation. Gray dots represent changes in individual vessels with respect to the mean flow rate in the corresponding generation and bars are relative changes of the mean flow rates in each generation.

