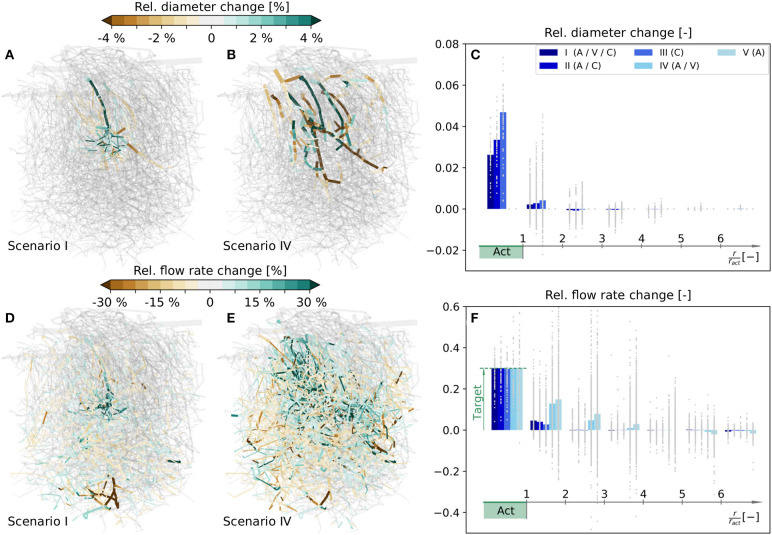
Figure 5.
Relative diameter and flow rate changes in a realistic microvascular network, when only selected vessel types are allowed to dilate and constrict. (A) Diameter changes, if A, V, and C can react (scenario I). (B) Diameter changes, if only A and V can react (scenario IV). (C) Capillary diameter changes for scenarios I–V. Results are shown as functions of distance to the barrel center. Gray dots are relative diameter changes in individual averaging cubes, and bars represent mean values obtained by averaging over all cubes within a certain distance to the activation center. (D–F) Corresponding relative changes of blood flow rates. In (F) the mean blood flow changes in Act are calculated based on the values in individual capillaries, i.e., with Equation (16), to demonstrate that the target flow rate increase is reached. For completeness, the relative diameter and flow rate changes for scenarios II, III, and V in the entire network are visualized in Figure S5. Furthermore, absolute flow rate changes normalized with the mean capillary blood flow rate in the activated barrel at baseline, i.e., , are visualized in Figure S6 for scenarios I–IV.

