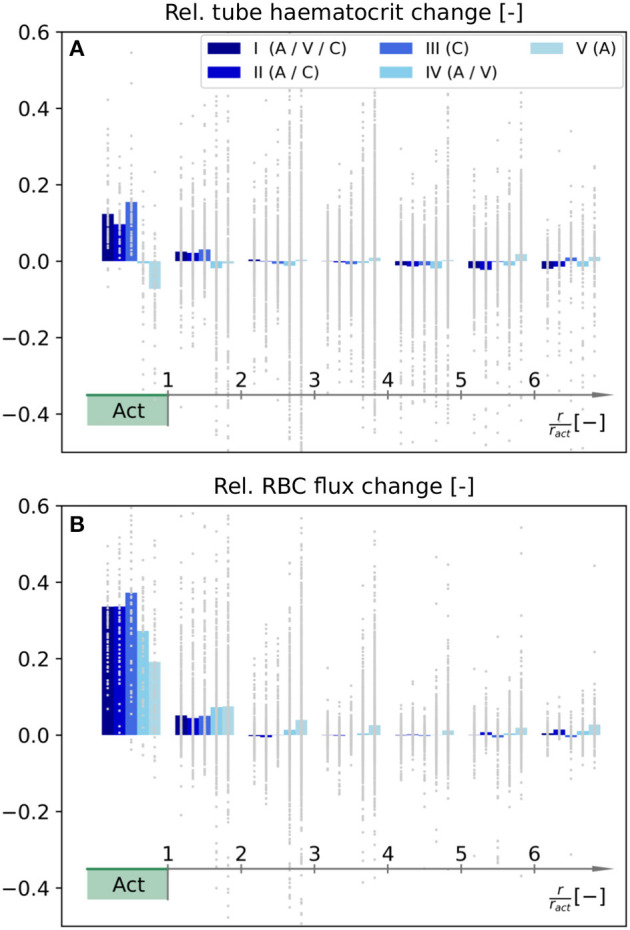
Figure 6.

Relative changes of tube haematocrit (A) and RBC flux (B) as functions of distance to the barrel center. Note that the color legend and the procedure to calculate the relative changes for individual averaging cubes are identical to Figures 5C,F. The RBC fluxes were determined by counting the number of discrete RBCs which enter each blood vessel on average.
