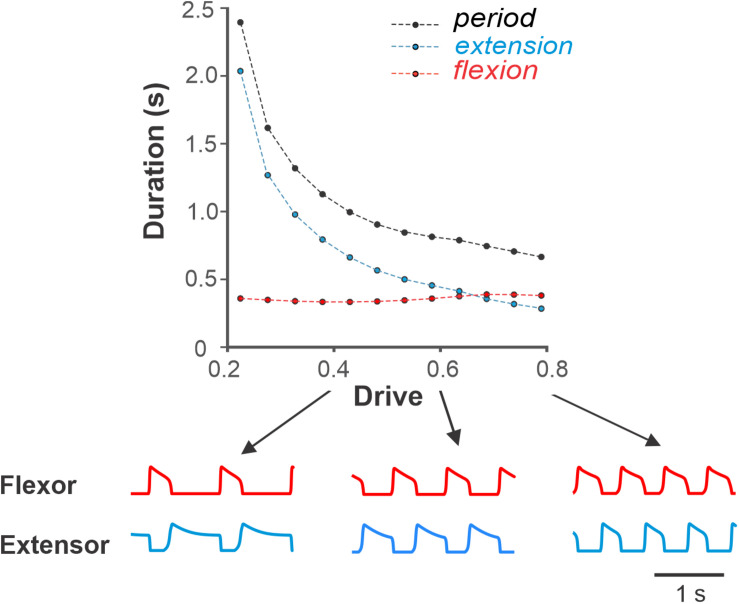
FIGURE 4.
Dependence of the period, flexion and extension on drive to flexor in the model of single RG. Simulations show decreasing duration of extension and relatively constant flexion with increasing drive similar to that during overground tied-belt locomotion in cats with increasing locomotor speed (Figure 3). Below, exemplar activity traces of flexor and extensor half-centers are shown for low (0.4), medium (0.6), and high (0.8) drive to flexor values.

