FIGURE 5.
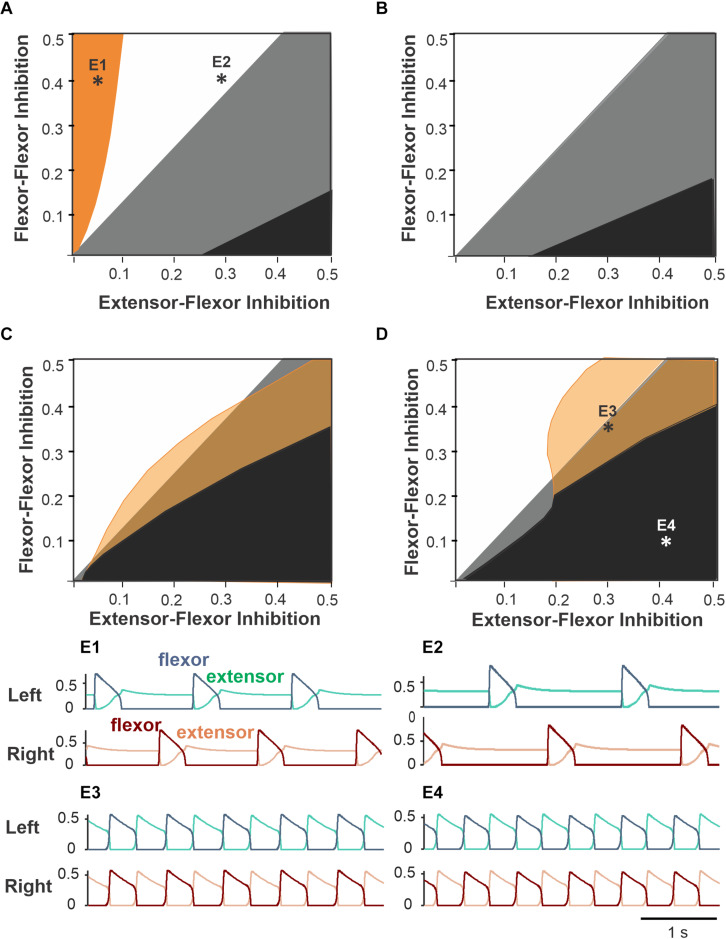
Partitioning of the parameter plane for different coordination patterns. The areas of regimes with different phase relationship between activities of left and right flexor half-centers are shown for varying flexor–flexor (F–F) inhibition and varying crossing extensor–flexor (E–F) inhibition at four different flexor drive values equal to left and right sides (symmetric case). (A) Drive = 0.3. Orange region: asymmetric alternations of left and right flexor activity – see example activity traces in panel E1. The white region corresponds to exact anti-phase left–right alternations (see panel E2 for an example. The black region corresponds to in-phase left–right synchronization like in panel E4. Bistability occurs in the gray region as antiphase and in-phase regimes coexist and can be realized depending on initial conditions. (B) Drive = 0.4. As we increase drive, the orange region disappears, and the black region of in-phase synchronization grows in size. (C) Drive = 0.5. With relatively high drive to flexors a new region appears (shown by yellow) with small phase difference between flexors (see panel E3 for an example). The black region of in-phase synchronization increases further. (D) Drive = 0.65. (E1–E4) Activity traces of left flexors (blue) and extensors (green) above and the right flexors (dark brown) and extensors (light brown) below corresponding to parameter points labeled accordingly in panels (A,D). (E1) Drive = 0.3, F–F inhibition = 0.4, E–F inhibition = 0.05. (E2) Drive = 0.3, F–F inhibition = 0.4, E–F inhibition = 0.3. (E3) Drive = 0.65, F–F inhibition = 0.1, E–F inhibition = 0.4. (E4) Drive = 0.65, F–F inhibition = 0.33, E–F inhibition = 0.3.

