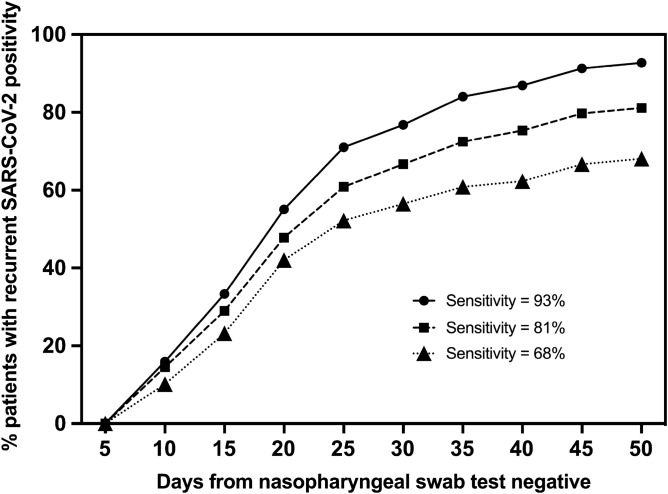
Figure 3.
High-risk patients and their recurrent SARS-CoV-2 positivity. The X-axis indicates the duration of time (days) from the first negative NP swab test to the first positive retest during strict post-discharge quarantine. The Y-axis indicates the percentage of high-risk patients who were retest positive within the specified duration of time after the first negative test. Three thresholds for high-risk patients were applied, giving an overall sensitivity of 93%, 81%, and 68%, respectively. SARS-CoV-2 Severe acute respiratory syndrome coronavirus 2.

