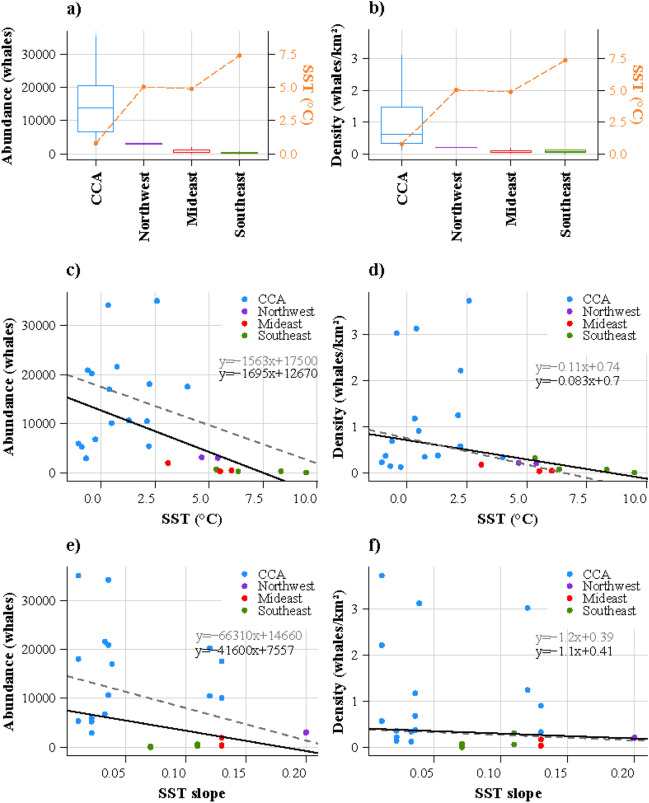
Figure 5.
Boxplots of (a) narwhal abundance and (b) narwhal density for the four sectors where abundance data were available. The horizontal lines in the box plots refer to the medians, and the dotted orange lines in (a) and (b) to the mean SST for each sector. Scatterplots showing the relationship between narwhal abundance and (c) SST and (e) SST slope, and narwhal density and (d) SST and (f) SST slope. The Theil-Sen regression lines are shown in black and grey with the corresponding equation. The black lines refer to the Theil-Sen regressions including all estimates for each sector, and the grey dotted lines to the latest estimate for each locality. Each dot represents an abundance estimate from the 11 summer grounds that contained more than one estimate.

