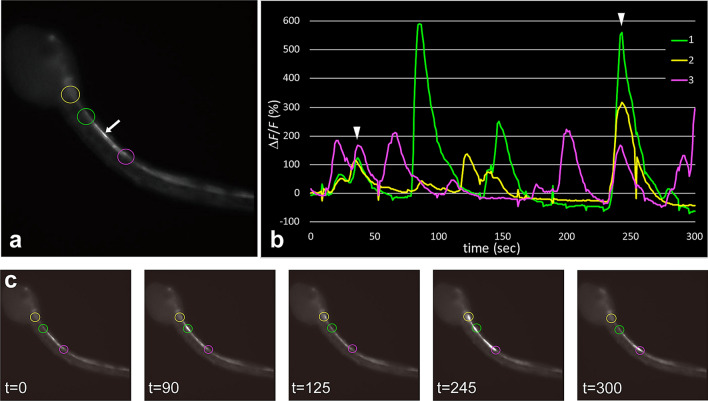
Figure 5.
Interconnection between gnrh2-expressing cells in the larval CNS. (a) Fluorescence image of a larva at 19 hpf, showing G-CaMP8 fluorescence in the motor ganglion and the anterior nerve cord. (b) The graph shows the temporal patterns of fluorescence intensity at the three sites indicated by circles in (a). The colors of the lines correspond to the sites indicated by circles in the respective colors. The Ca2+ transients occurred independently of each other, but sometimes occurred at the same time (arrowheads). (c) Representative images of the larva recorded at the times indicated (in seconds). Serial images of the larva shown in (A) are shown in Movie S2.

