Figure 6.
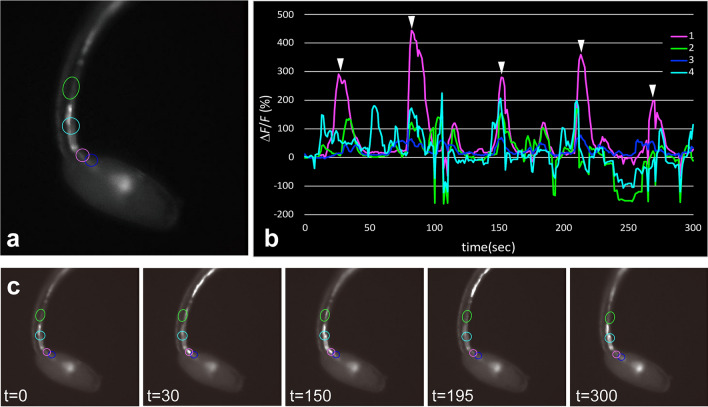
Periodic oscillation of Ca2+ transients in a gnrh2-expressing cell in the motor ganglion. (a) Fluorescence image of a larva at 20 hpf, showing G-CaMP8 fluorescence in the motor ganglion and the anterior nerve cord. (b) The graph shows the temporal patterns of fluorescence intensity at the four sites indicated by circles in (a). The colors of the lines correspond to the sites indicated by circles in the respective colors. Ca2+ spikes were periodically observed at regular intervals in the cell indicated by the magenta circle in (a) (arrowheads). (c) Representative images of the larva recorded at the times indicated (in seconds). Serial images of the larva shown in (a) are shown in Movie S3.

