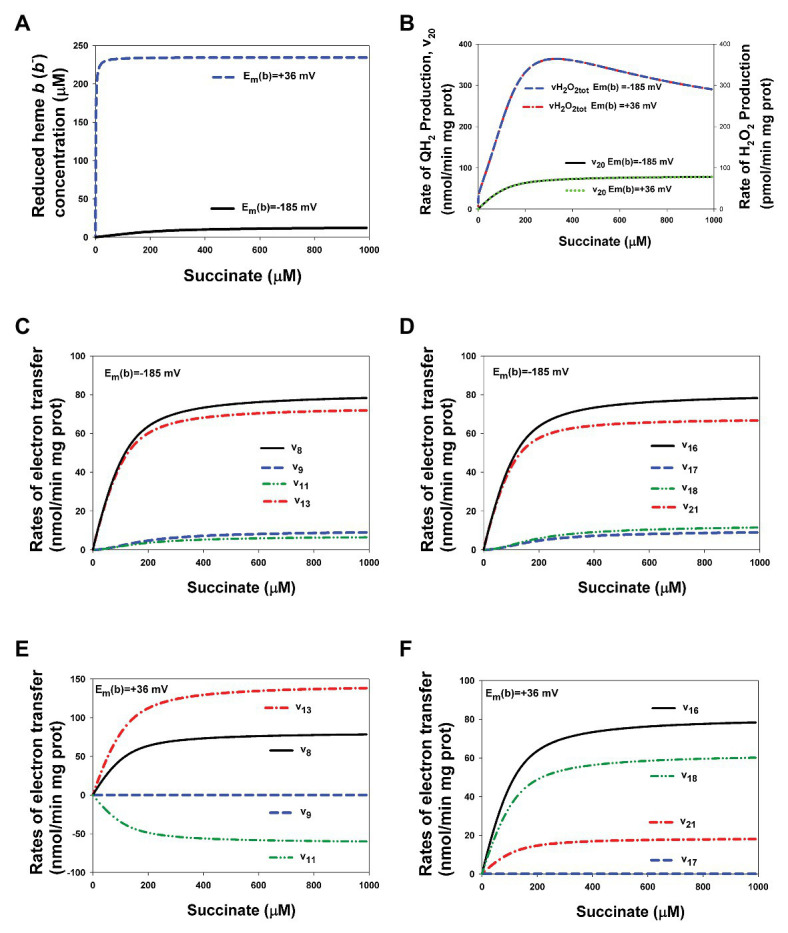
Figure 6.

Computer simulated alterations in the reduced heme b concentration and rates of electron flows in CII related to changes in the value of heme b midpoint potential, Em(b), from −185 up to +36 mV. (A) The dependence of the reduced heme b, b−, concentration on the succinate concentration at two different values of Em(b), −185 mV (black solid curve) and +36 mV (blue dashed curve). (B) The dependence of the rate of QH2 production, v20, and the total rate of H2O2 generation by CII, vH2O2tot, at two different values of Em(b), −185 mV (black solid and blue dashed curves, respectively) and + 36 mV (green dot and red dash-dot curves, respectively). (C–F) Computer simulated dependence of the rates of electron flows from [4Fe-4S] cluster to ubiquinone at ubiquinone (Q)-binding site on the succinate concentration is shown at two different values of Em(b), −185 mV (C,D) and +36 mV (E,F) and separately for the first (C,E) and second (D,F) electron transfer. All computer simulations were made at model parameter values presented in Supplementary Table S2.
