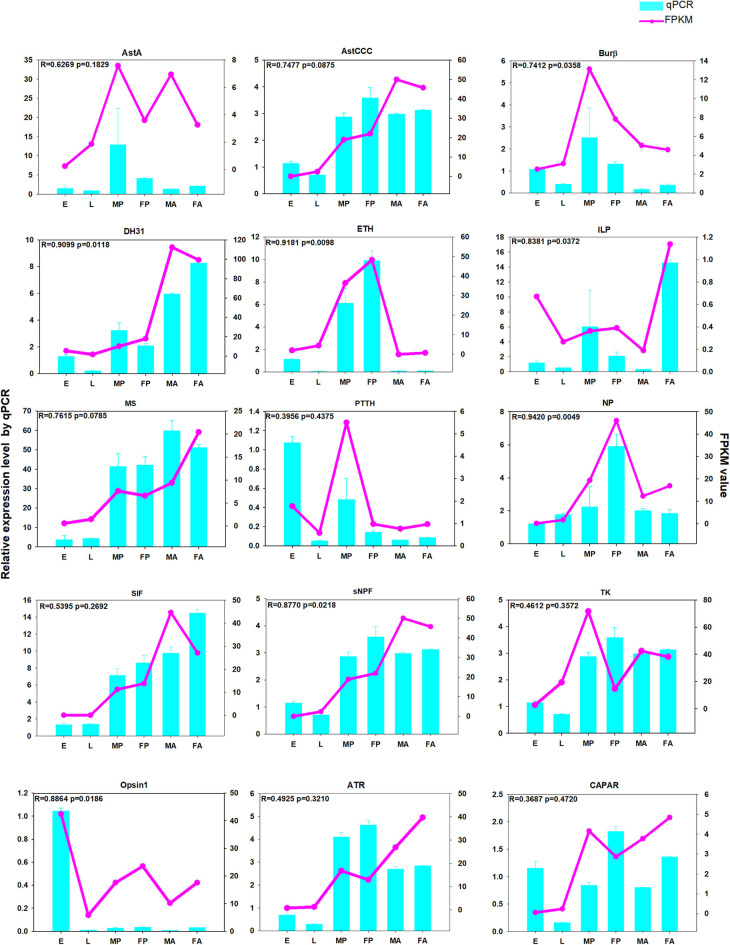
Figure 11.
The qPCR analysis of relative expression levels of neuropeptide genes and neuropeptide receptor genes at different developmental stages. E, embryos; L, larvae; FA, female adults; FP, female pupae; MA, male adults; MP, male pupae. The pink-dotted line represents the FPKM (fragments per kilobase of transcript per million) value, and the relative expression levels from the qPCR are depicted in the light blue histogram.

