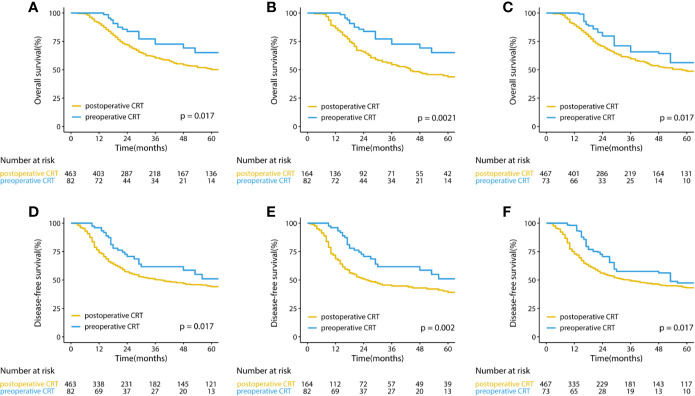
Figure 3.
Kaplan–Meier curves for overall survival and disease-free survival in (A, D) the original cohort and (B, E) the cohorts after PSM and (C, F) IPTW-adjusted analyses of patients with gastric cancer. CRT, chemoradiotherapy; PSM, propensity score matching IPTW, inverse probability of treatment weight.

