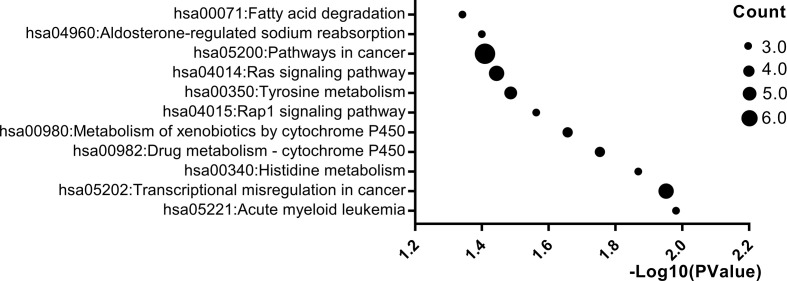
Figure 3.
Significantly enriched pathway terms of DEGs. X-axis reflects p value [− log10(p value)]. Y-axis reflects different passway terms. The node size reflects gene count: the bigger the gene count, the bigger the node size is (*p < 0.05). We only showed items with p-values less than 0.05 in the figure.

