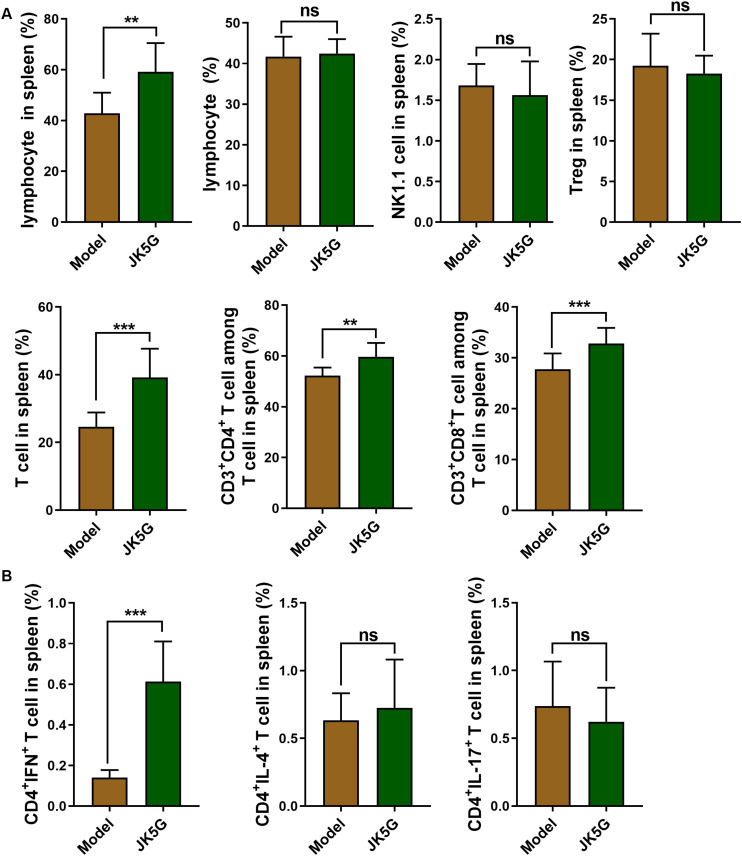
FIGURE 3.
Flow cytometry of the immune cells in spleen. Compared with the model group, the proportions of lymphocytes, T cells, CD3+CD4+ T cells, and CD3+CD8+ T cells (A), as well as CD4+interferon+ T cells (B) in the microecological preparation group were significantly increased (**p < 0.01; ***p < 0.001).

