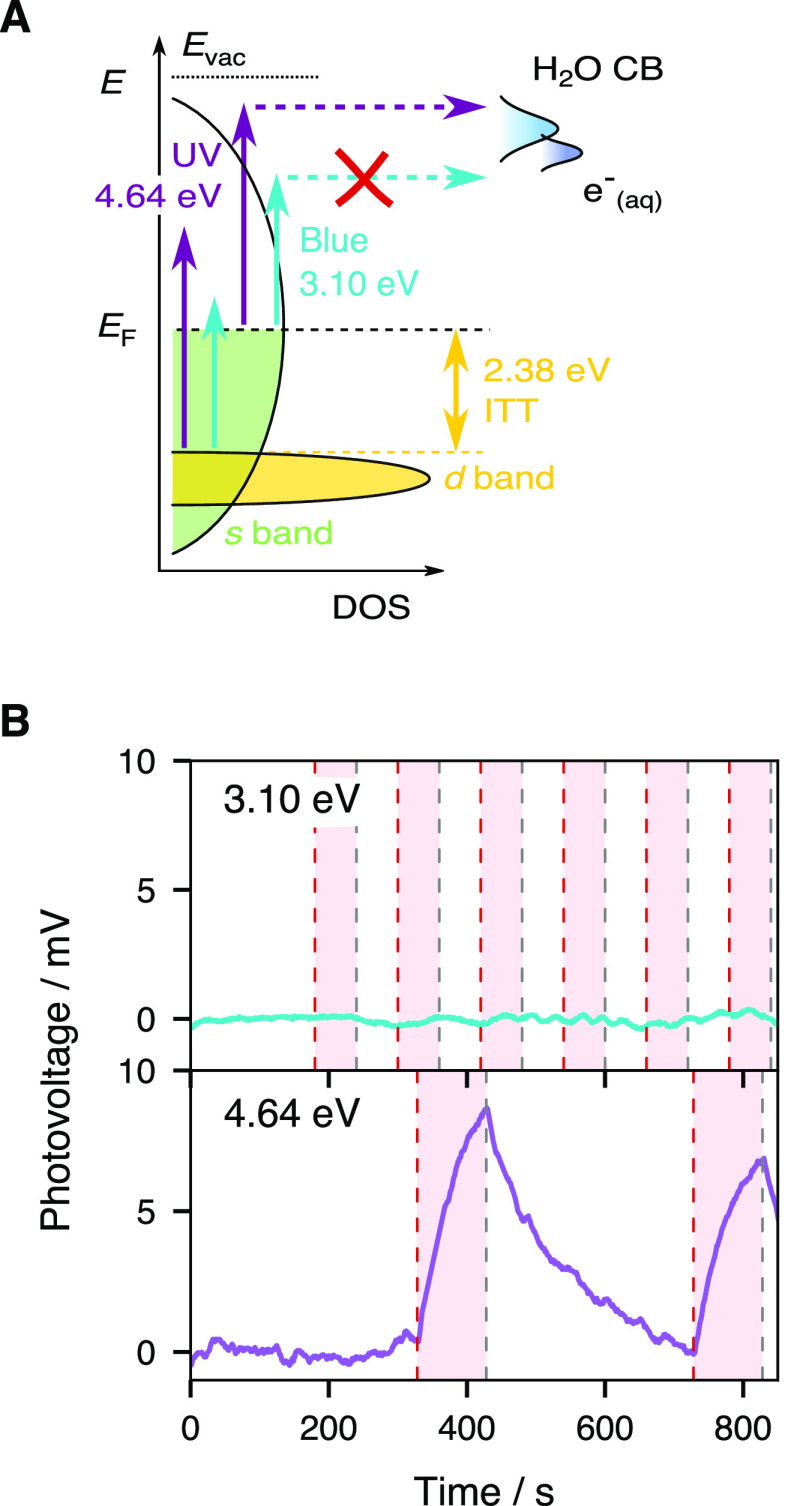
Figure 2.
(A) Schematics of gold’s density of states (DOS) and water’s conduction band (CB) with optical transitions enabled by UV (4.64 eV) and blue (3.10 eV) photons. (B) Comparison of the photovoltage when the first excitation pulse is changed from UV (bottom) to blue (top). The second pulse’s photon energy is 0.31 eV in both cases. A polynomial baseline has been removed from the traces to facilitate comparison. The red stripes show the times during which the shutter is open and the second pulse impinges on the electrode.

