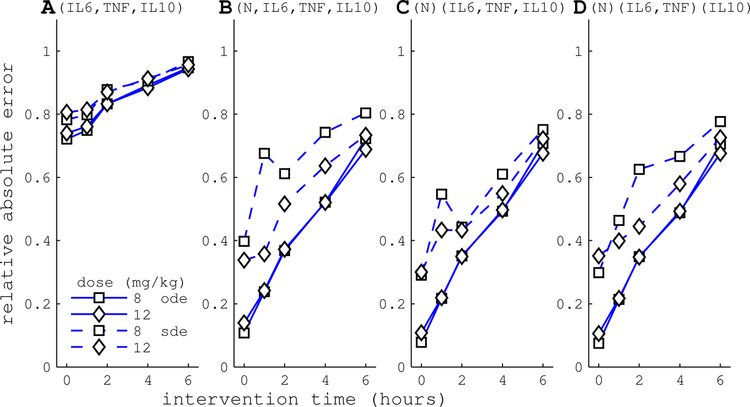
Figure 4.
HA performance is measured by relative absolute error, RAEHA, calculated from time of intervention through 24 h. RAEHA = 0 implies perfect control, while RAEHA = 1 indicates the controller performed no better than null treatment. The x-axis corresponds to the time of HA intervention, where t = 0 is the time of endotoxin administration. Control simulations were based on the deterministic endotoxemia model (solid lines) or stochastic model with PF state estimation (dashed lines). Panels correspond to HA device configurations in Table 2. (A) Configuration A, which captures cytokines only, performs poorly. Configurations that capture white blood cells, (B–D), perform well. Hypothetical multi-channel HA devices with differential specificity (C,D) do not substantially improve performance over (B). In all cases, HA performance declines when treatment is delayed.

