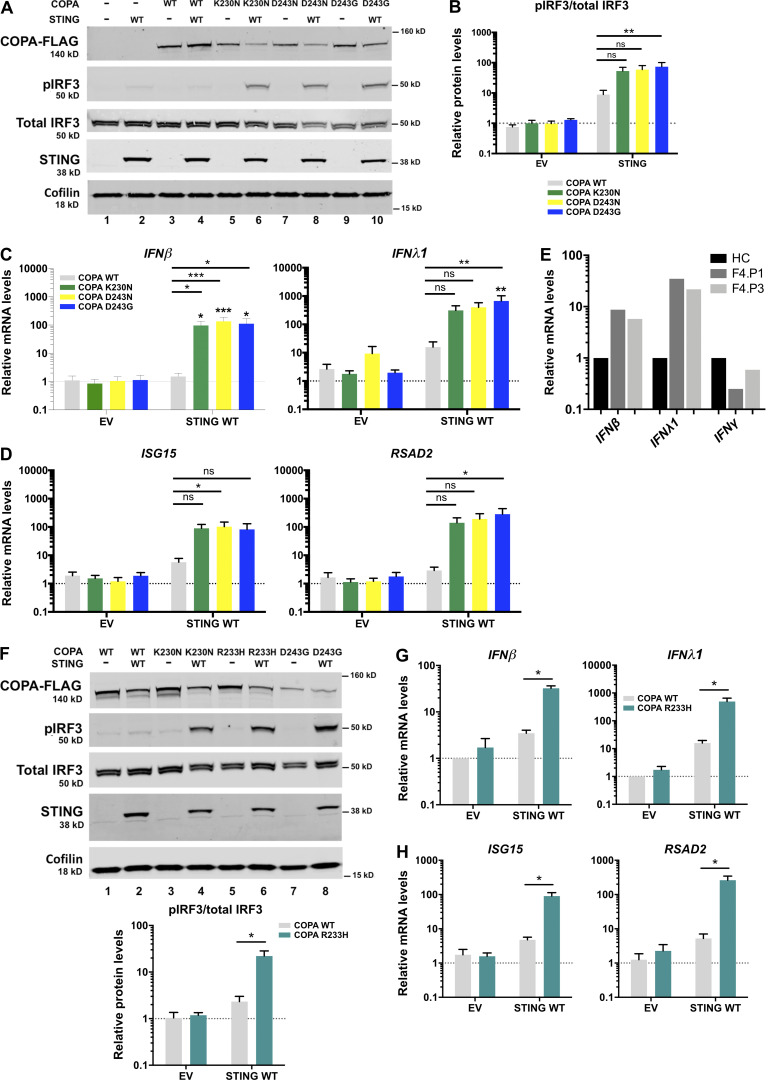
Figure 3.
COPA mutants induce IFN production and signaling through STING. (A) Western blot analysis of FLAG, IRF3 phosphorylated (pIRF3) at Ser396, total IRF3, STING, and Cofilin in whole-cell lysates of HEK293T cells cotransfected with WT STING and WT COPA or mutant COPA plasmids (K230N, D243N, D243G) or corresponding control (EV or −) plasmids for 48 h. Representative results from four independent experiments. (B) Quantification of phosphorylated IRF3 (at position Ser396) relative to total IRF3 expressed as fold over EV signal as observed in A. Mean ± SEM of four independent experiments, analyzed with the Kruskal–Wallis test (**, P= 0.0069). (C and D) mRNA expression analysis assessed by RT-qPCR of IFNβ, IFNλ1 (C), and two ISGs (ISG15, RSAD2; D) in HEK293T cotransfected with EV or WT STING and WT COPA or mutant COPA plasmids. Means ± SEM of five independent experiments, statistically analyzed using two-way ANOVA and the Dunnett’s multiple comparisons test (statistics above black lines), with results above each bar indicating the comparison of expression in cells cotransfected with WT STING and each of the three COPA mutant plasmids compared with the cells cotransfected with EV and the corresponding COPA mutant plasmid by two-way ANOVA with Sidak’s multiple comparisons test (*, P < 0.05; **, P < 0.01; ***, P < 0.001; ns, not significant). (E) RT-qPCR gene expression analysis of IFNβ (type I IFN), IFNλ1 (type III IFN), and IFNγ (type II IFN) in PBMCs from one symptomatic patient (F4.P1) and his asymptomatic mother (F4.P3), and one HC, after overnight culture in one experiment. (F) Western blot analysis of HEK293T cotransfected with WT STING and WT COPA or mutant COPA plasmids (K230N, R233H, D243G) or EV (−) as in A. Representative results for three experiments. Results were quantified for R233H mutant compared with WT and averaged below. Data were statistically analyzed using two-way ANOVA with Sidak’s test for multiple comparison (*, P < 0.05). (G and H) mRNA expression analysis assessed by RT-qPCR of IFNβ, IFNλ1 (G), and two ISGs (ISG15, RSAD2; H) in HEK293T cotransfected with EV or WT STING and WT COPA or COPA R233H plasmids. Means ± SEM of three independent experiments, statistically analyzed using two-way ANOVA and Sidak’s multiple comparisons test (*, P < 0.05).

