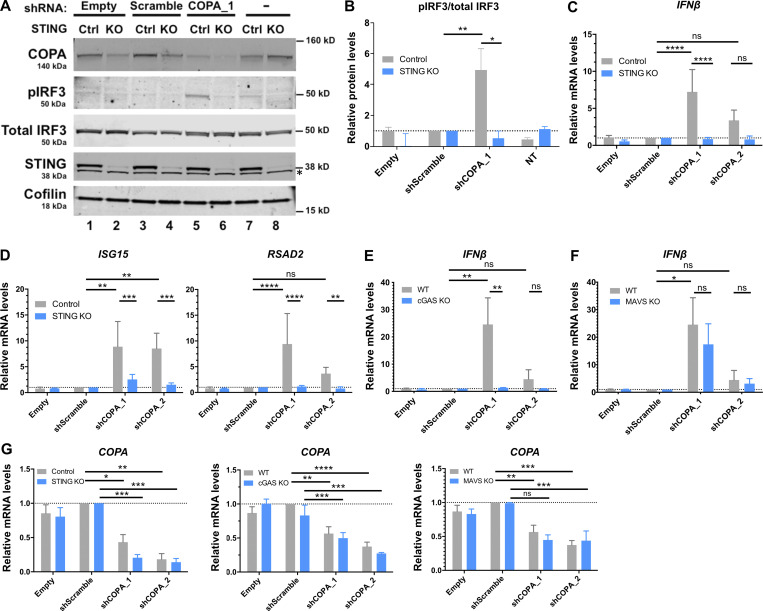
Figure 4.
Loss of COPA induces STING-dependent type I IFN signaling. (A) Western blot analysis of IRF3 phosphorylated at Ser396, total IRF3, COPA, STING, and Cofilin in whole-cell lysates of control (Ctrl) or STING KO THP-1 cells transduced with an EV, a scrambled shRNA or an shRNA targeting COPA (shCOPA_1), or non-transduced (NT; left). Data are representative of three independent experiments. Asterisk indicates unspecific band. Results for a second shRNA targeting COPA (shCOPA_2) are shown in Fig. S2, A and B. (B) Quantification of phosphorylated IRF3 (at position Ser396) relative to total IRF3 expressed as fold over scrambled shRNA signal observed in A. Means ± SEM of three independent experiments were statistically analyzed using one-way ANOVA and two-way ANOVA with Sidak’s multiple comparisons test for comparison of results with shScramble vs. shCOPA_1 (**, P = 0.0026) and results in control vs. STING KO THP-1 cells for shCOPA_1 (*, P = 0.0104), respectively. (C and D) mRNA expression analysis assessed by RT-qPCR of IFNβ (C) and two of six tested ISGS (ISG15, RSAD2, [D]; and see Fig. S2 B) in control or STING KO THP-1 cells transduced with an EV, a scrambled shRNA, two different shRNAs targeting COPA (shCOPA_1 and shCOPA_2), or nontransduced (NT). Means ± SEM of three independent experiments, statistically analyzed using one-way ANOVA and two-way ANOVA with Sidak’s multiple comparisons test for comparison of results with shScramble vs. each shCOPA, and results in control vs. STING KO THP-1 cells for each shCOPA, respectively. **, P < 0.01; ***, P < 0.001; ****, P < 0.0001. (E and F) mRNA expression analysis assessed by RT-qPCR of IFNβ in WT or THP-1 cells null for cGAS (E) or MAVS (F) transduced with an EV, a scrambled shRNA, or two different shRNAs targeting COPA (shCOPA_1 and shCOPA_2). Means ± SEM of three independent experiments, statistically analyzed using one-way ANOVA and two-way ANOVA with Sidak’s multiple comparisons test for comparison of results with shScramble vs. each shCOPA, and results in WT vs. cGAS KO THP-1 cells for each shCOPA, respectively. *, P < 0.05; **, P < 0.01; ***, P < 0.001). (G) mRNA expression of COPA assessed by RT-qPCR in THP-1 cells control and null for STING (left), or WT and null for cGAS (middle) or MAVS (right) transduced with an EV, a scrambled shRNA, or shCOPA_1 and shCOPA_2. Mean ± SEM of three independent experiments were statistically analyzed in one-way ANOVA (shScramble vs. shCOPA for WT and control THP-1 cells) or two-way ANOVA (WT or control vs. THP-1 cells null for STING, cGAS, or MAVS, for each shCOPA) with Sidak’s multiple comparisons test: *, P <0.05; **, P < 0.01; ***, P < 0.001; ****, P < 0.0001. ns, not significant.

