Figure 2.
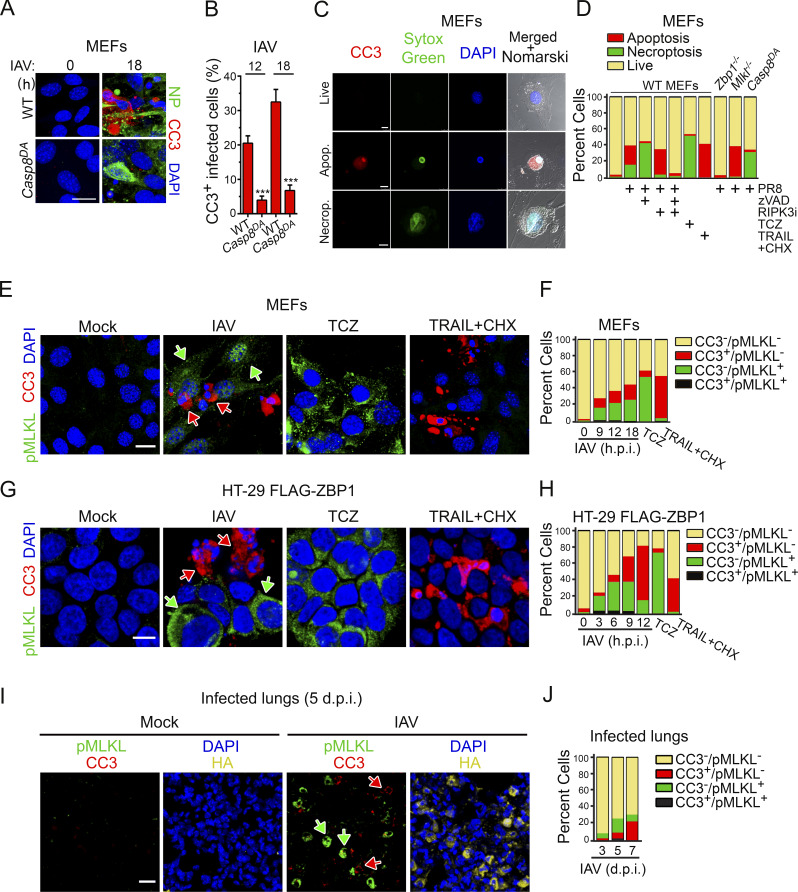
IAV-induced apoptosis and necroptosis do not occur in the same infected cell. (A) WT and Casp8DA MEFs infected with PR8 (MOI, 2) were examined for apoptosis using antibodies to CC3 (red) at 18 h.p.i. Virus replication was determined by staining for NP (green). Scale bar = 20 µm. (B) Quantification of CC3 in virus-positive infected cells at the indicated times after infection. Data are pooled from four fields with 30–60 cells/field; data are from one of four experiments with similar results. (C) MEFs were infected with PR8 (MOI, 2), harvested at 18 h.p.i., and stained for CC3 (red) and SYTOX Green. Scale bar = 10 µm. (D) Quantification of live, apoptotic, and necroptotic cells following the indicated treatments at 18 h (PR8; MOI, 2) or 12 h (TCZ, TRAIL + CHX). Data are pooled from four fields with 30–60 cells/field; data are from one of four experiments with similar results. (E) Primary MEFs infected with PR8 (MOI, 2; 18 h) or treated with either TCZ (12 h) or TRAIL + CHX (12 h) were examined for apoptosis and necroptosis by immunofluorescence using antibodies to CC3 (red) and pMLKL (green), respectively. Scale bar = 20 µm. (F) Quantification of CC3 and/or pMLKL positivity at the indicated times after infection (PR8) or at 12 h (TCZ, TRAIL + CHX). Data are pooled from four fields with 20–50 cells/field; data are from one of four experiments with similar results. (G) Human HT-29 cells made competent for IAV-activated cell death by stable retroviral expression of FLAG-tagged hZBP1 were infected with PR8 (MOI, 2; 9 h.p.i.) or treated with either TCZ (6 h) or TRAIL + CHX (9 h) and examined for apoptosis and necroptosis by immunofluorescence using antibodies to CC3 (red) and pMLKL (green). Scale bar = 10 µm. (H) Quantification of CC3 and/or pMLKL positivity at the indicated times after infection (PR8; MOI, 2). TCZ- and TRAIL + CHX–treated cells were evaluated at 6 h and 9 h after treatment, respectively. Data are pooled from four fields with 30–50 cells/field; data are from one of four experiments with similar results. (I) Mock- or IAV-infected lungs were stained for CC3 (red) or pMLKL (green) at 5 d.p.i. Nuclei are stained with DAPI (blue), and IAV HA is shown in yellow. Scale bar = 20 µm. (J) Quantification of pMLKL- and CC3-positive cells in IAV-infected lungs at the indicated days after infection. Arrows in E, G, and I point to pMLKL+ (green) or CC3+ (red) cells. Data are pooled from seven fields with 60–130 cells/field; data are from one of two experiments with similar results. Unpaired Student’s t test (B). Error bars represent mean ± SD. ***, P < 0.005.

