Figure S1.
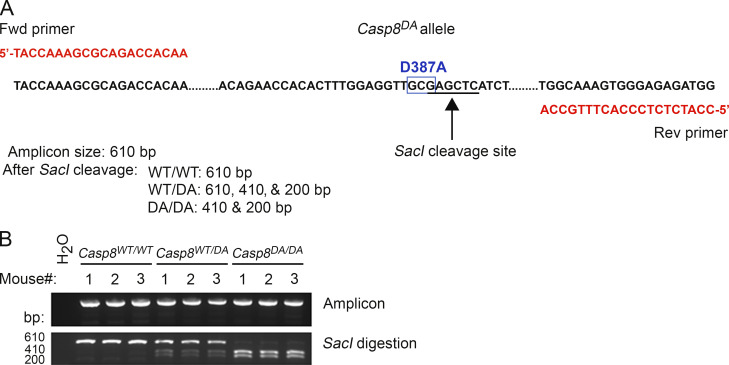
Generation of Casp8DA mice. (A) Schematic of the Casp8DA allele showing primer sequences, location of the SacI cleavage site, and sizes of expected PCR amplicons after cleavage with SacI. (B) PCR results showing undigested (top) or SacI-digested (bottom) amplicon products produced from genomic tail DNA of mice from the indicated genotypes.

