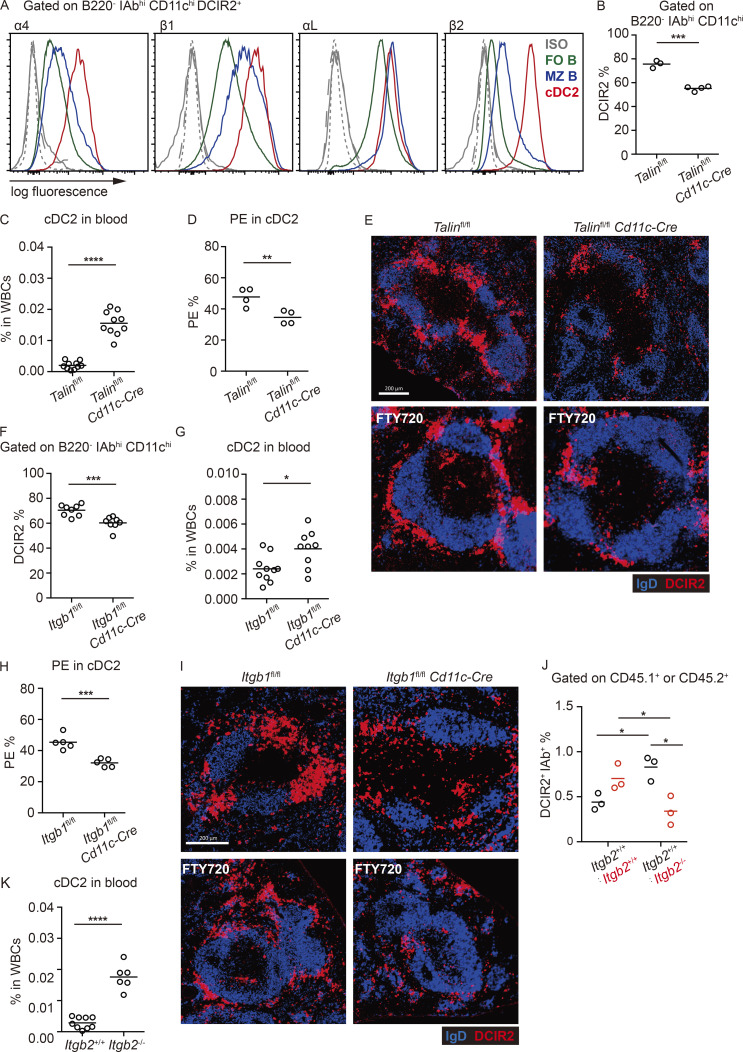
Figure 4.
Integrins and integrin adaptor talin are required in splenic cDC2s. (A) Representative histogram plots of cell surface integrins on MZ B cells (blue line), follicular B cells (FO B; green line), and cDC2s (red line). Gray lines are staining controls for MZ (dash) and follicular (dot) B cells and cDC2s (solid). (B and C) Frequencies of DCIR2+ cDC2s in spleen (B) and blood (C) in Cd11c-Cre Talinfl/fl and control mice. (D) Frequencies of in vivo anti-CD45-PE–labeled cDC2s in spleens of mice of the indicated genotypes. (E) Representative distribution patterns of DCIR2+ cDC2s (red) relative to B cells (blue) in spleens of untreated (upper panel) and 15-h FTY720-treated (lower panel) mice of the indicated genotypes. Scale bar, 200 µm. (F and G) Frequencies of DCIR2+ cDC2s in spleens (F) and blood (G) in Cd11c-Cre Itgb1fl/fl and control mice. (H) Frequencies of in vivo anti-CD45-PE–labeled cDC2s in spleens of mice of the indicated genotypes. (I) Representative distribution patterns of DCIR2+ cDC2s (red) relative to B cells (blue) in spleens of untreated (upper panel) and 15-h FTY720-treated (lower panel) mice of the indicated genotypes. Scale bar, 200 µm. (J) Frequencies of DCIR2+ IAb+ cDC2s in spleens of Itgb2+/+ (CD45.1+):Itgb2+/+ (CD45.2+) and Itgb2+/+ (CD45.1+):Itgb2−/− (CD45.2+) mixed BM chimeras. Two-way ANOVA was applied. (K) Frequencies of DCIR2+ cDC2s in blood of 4-wk-old Itgb2−/− and control mice. Each symbol represents one mouse, and lines denote means. Data for cDC2s in blood and F are pooled from two independent experiments. For other data, one of two independent experiments with similar results is shown. Sections are representative of multiple spleen cross sections from six mice of each type. *, P < 0.05; **, P < 0.01; ***, P < 0.001; ****, P < 0.0001.

