Figure 5.
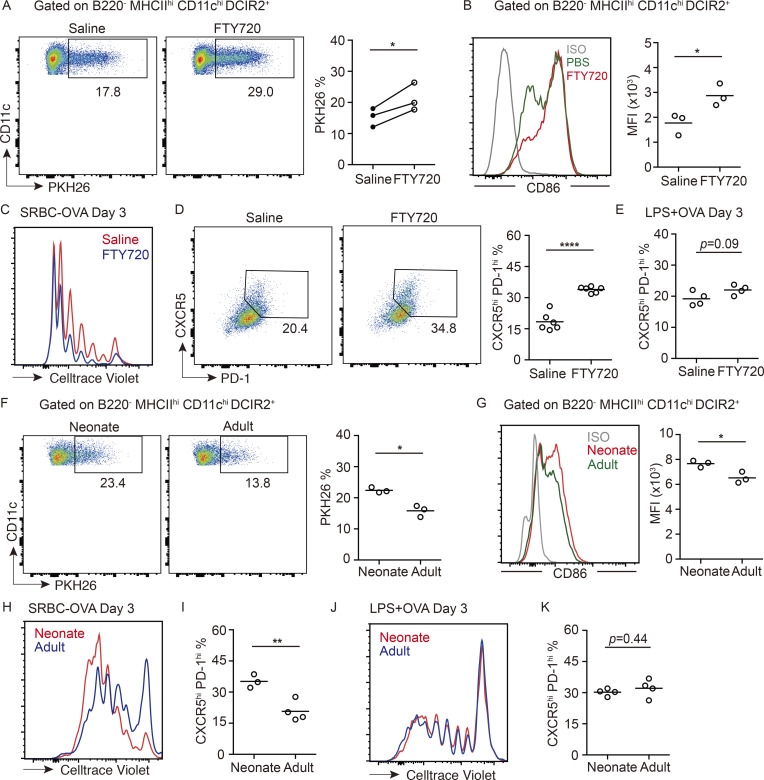
MZ localization of cDC2s augments particulate antigen capture and CD4 T cell responses. (A) Representative FACS plot and frequencies of PKH26-dye acquisition in DCIR2+ cDC2s from 4-h saline- or FTY720-treated mice, 3 h after PKH26-labeled SRBC immunization. Each symbol represents one independent experiment, and each line in the graph represents a paired experiment, with at least three mice in each group per experiment. (B) Geometric mean fluorescence intensity (MFI) and representative histogram of surface CD86 expression on cDC2s from mice treated as in A. (C–E) Representative FACS plot of proliferation (C) and CXCR5hi PD-1hi T cell gating (D, left) and frequencies of CXCR5hi PD-1hi T cells (D, right; and E) among transferred OT-II T cells in 4-h FTY720- or saline-pretreated mice, 3 d after SRBCs-OVA (C and D) or soluble OVA plus LPS (E) immunization. (F) Representative FACS plot and frequencies of PKH26+ cells in DCIR2+ cDC2s of neonatal or adult mice 3 h after immunization with PKH26-labeled SRBCs. (G) MFI and representative histogram of surface CD86 expression on cDC2s from mice treated as in F. (H–K) Representative FACS plot of proliferation and frequencies of CXCR5hi PD-1hi T cells in transferred OT-II T cells in indicated mice at day 3 after SRBC-OVA (H and I) or soluble OVA plus LPS (J and K) immunization. Each symbol represents one mouse, and lines denote means. One of two independent experiments with similar results is shown. *, P < 0.05; **, P < 0.01; ****, P < 0.0001.

