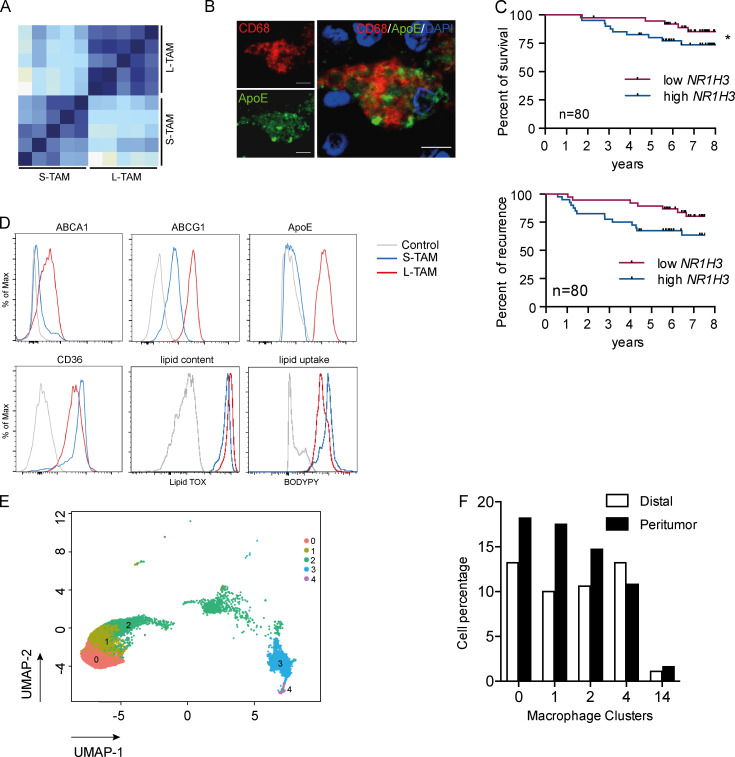
Figure S3.
Profile of small and large macrophages. (A) Correlation matrix of the whole dataset of genes in small and large macrophages from five CLM patients. Heatmap displays Pearson correlation coefficients according to the color code (light blue for low correlation, dark blue for high correlation). (B) Immunofluorescence on a CLM specimen showing a macrophage (CD68 in red) rich in ApoE protein (in green). Scale bars: 20 µm. (C) Kaplan-Meier survival curves of breast cancer patients from public datasets (GSE1456), stratified by first and last quartiles of NR1H3 expression score (LXR gene). Curves show disease-specific survival (top) and DFS (bottom). P = 0.09 (top panel) and *, P = 0.043 by Gehan-Breslow-Wilcoxon test. (D) Representative FACS plots of lipid transporters, ApoE, CD36, LipidTOX (lipid content), and BODIPY (lipid uptake) in S-TAMs and L-TAMs. (E) UMAP projection of myeloid cells from PT (n = 3) and distal (n = 3) human livers. Only macrophage clusters (c0, c1, c2, c3, and c4) are shown (n = 13,768 cells). Each dot represents an individual cell. (F) Bar graph showing the relative abundance of each macrophage cluster respect to the total dataset in distal and PT regions.

