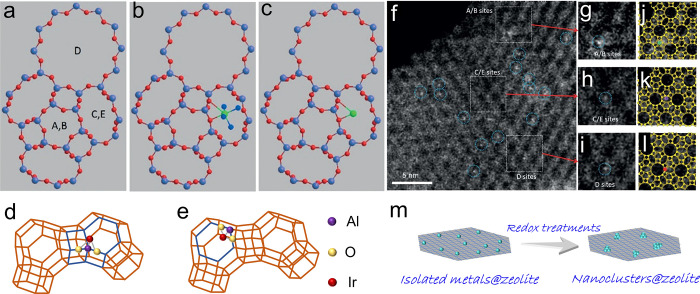
Figure 2.
(a–c) Models of zeolite LTL with (a) different pore and (b) [Pt(NH3)4]2+ and (c) PtOx located in the 8-MR. Reprinted with permission from ref (80). Copyright 2014 Wiley-VCH. The models illustrate the positions of the Ir+ ions: (d) T5, three-hollow position, (e) T6, six-ring. (f) STEM images showing site-isolated Pt atoms in KLTL zeolite in the as-prepared samples. White features in dashed blue circles indicate Pt atoms. (g–i) Magnified views of the highlighted regions in (f), containing one Pt atom each at A/B sites in (g), at C/E sites in (h), and at D sites in (i). (j–l) Simulations of the LTL zeolite in the [110] direction superimposed on the magnified views in (g–i), showing Pt atoms (green) at A/B sites in (j), at C/E sites in (k) (purple), and at D sites in (l) (red). Pt atoms are located right at the edge of the 12-membered rings of site D; between the two 12-membered rings of sites C/E; and in the center of three 12-membered rings of sites A/B. Reprinted with permission from ref (80). Copyright 2014 Wiley-VCH. (m) Schematic illustration of the aggregation of Pt species during the redox treatment.

