Figure 3.

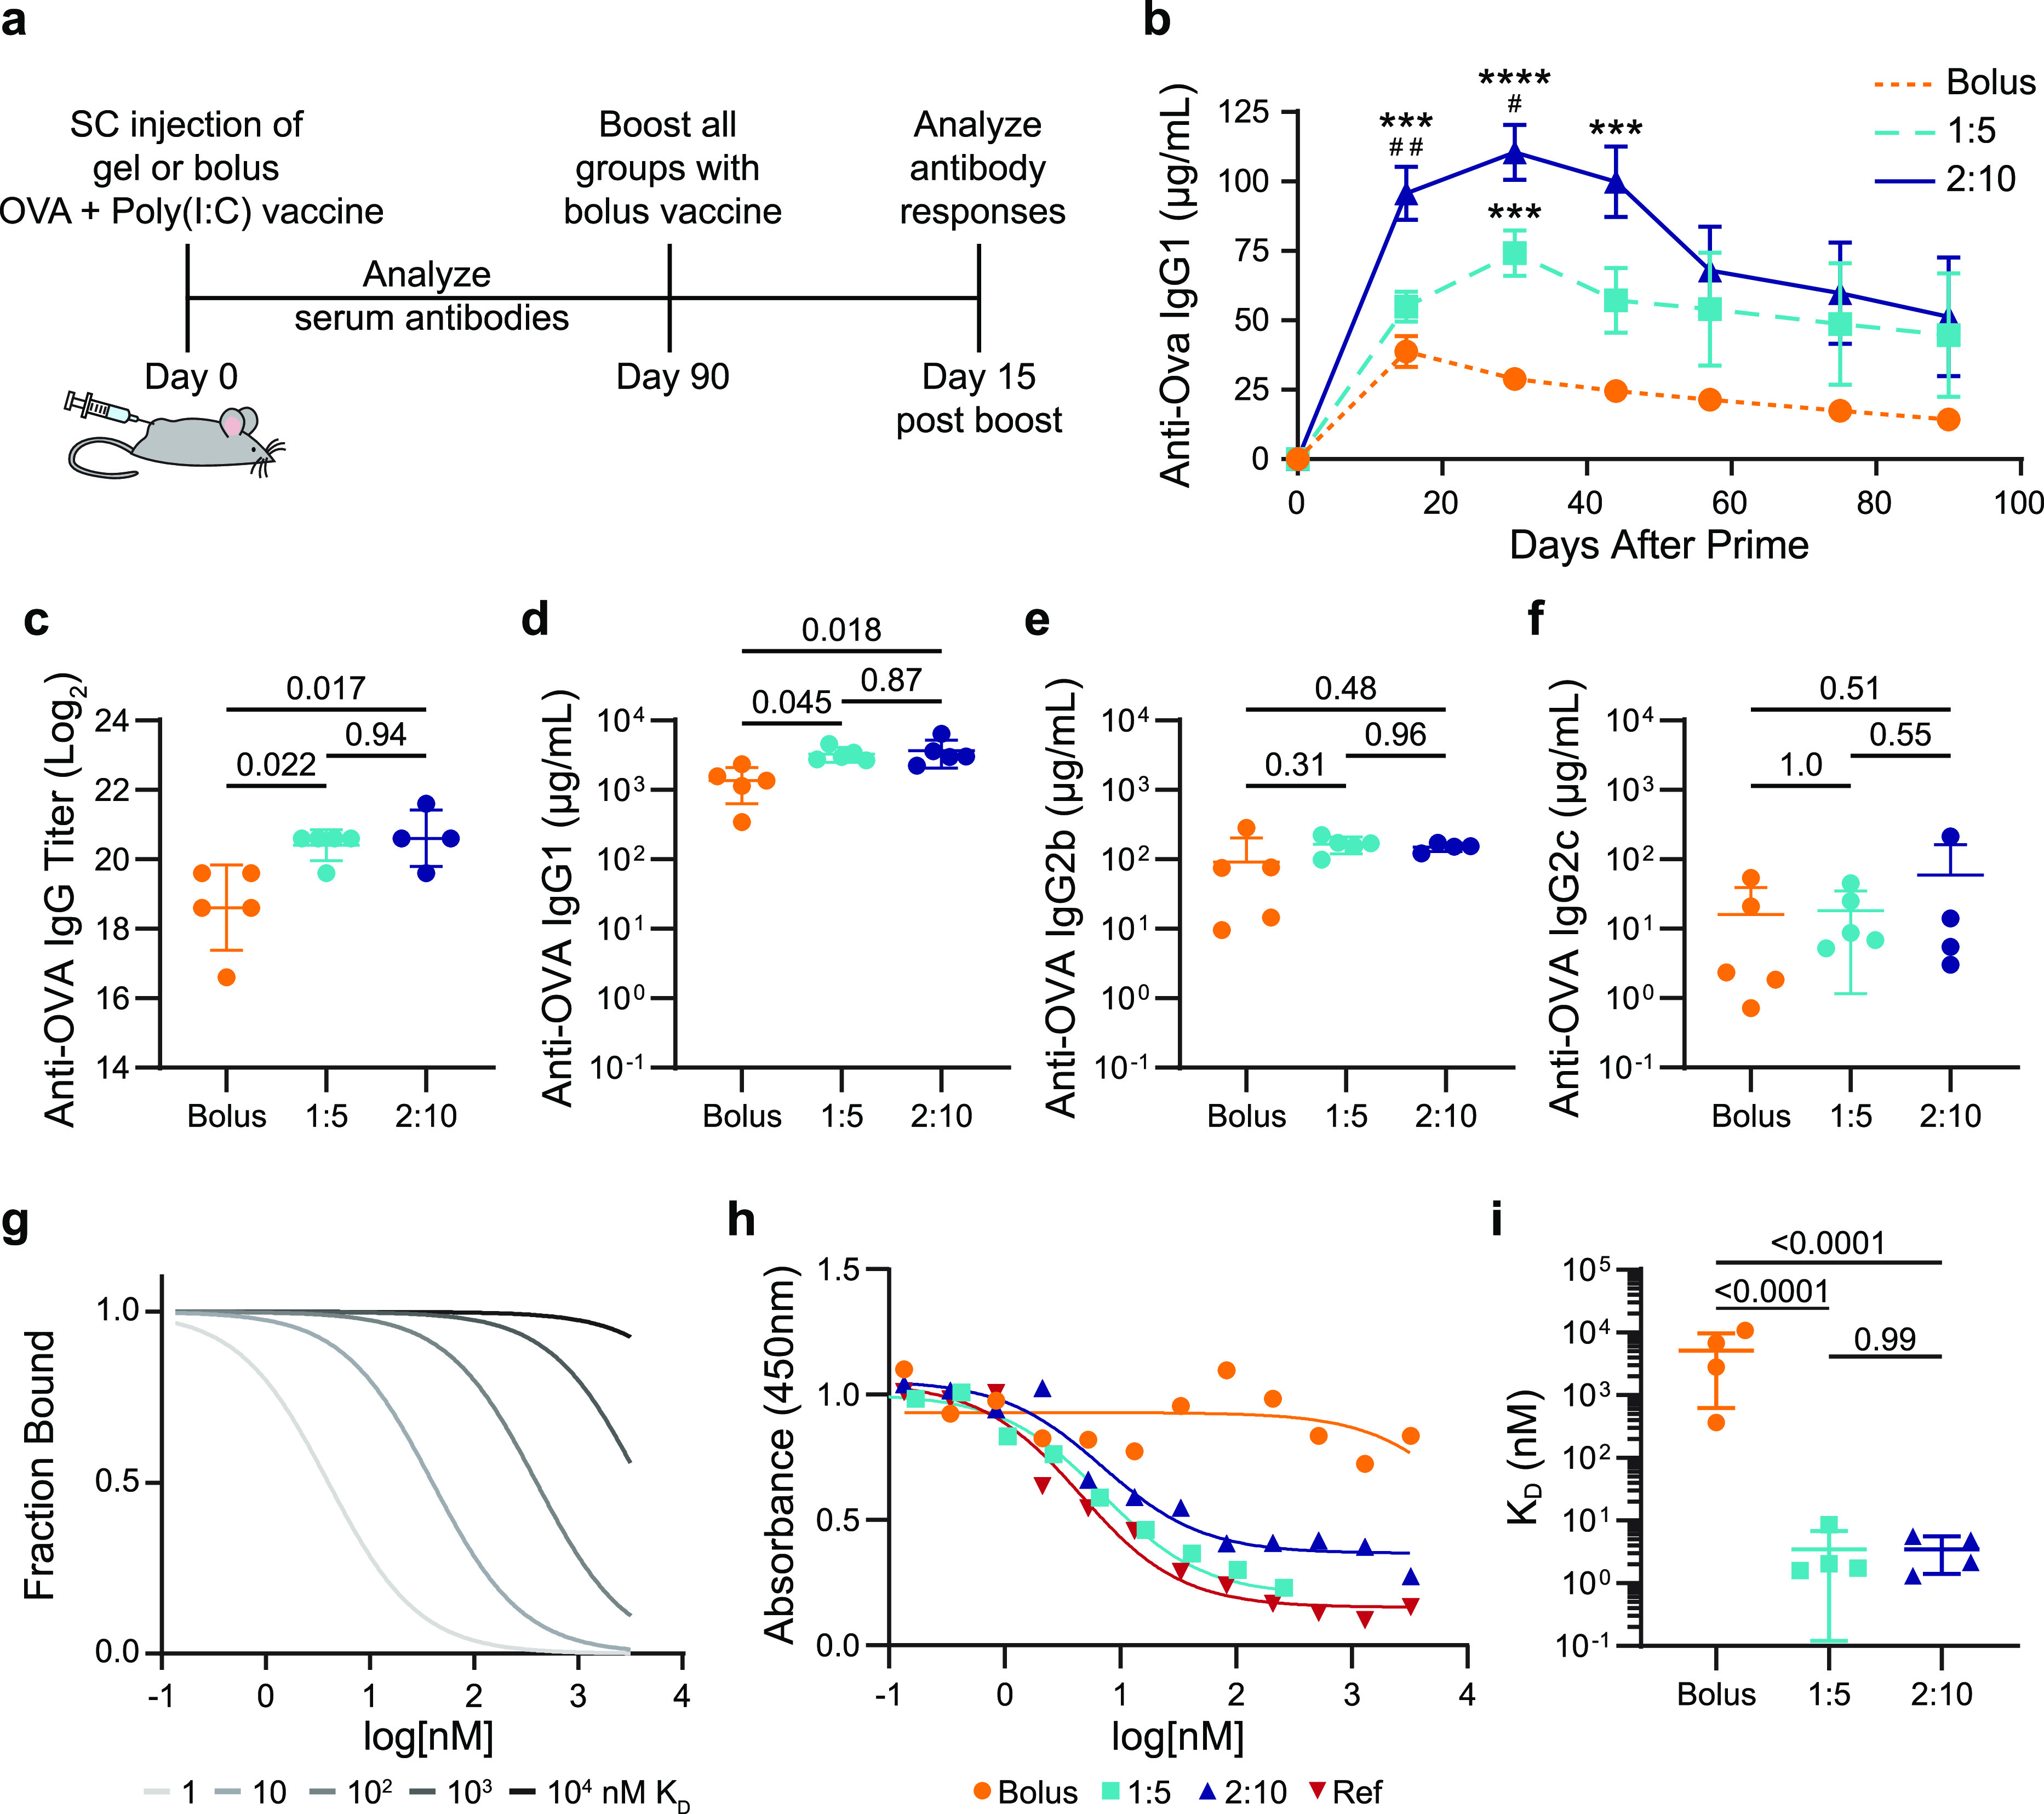
Antibody concentration and affinity following immunization. (a) Timeline of the experimental setup shows subcutaneous (SC) injection of a model vaccine containing OVA and Poly(I:C) in a gel or bolus formulation at day 0, antibody analysis over time following a single administration, boost with a bolus vaccine formulation at day 90, and analysis of the immune response 15 days after the boost. (b) Serum anti-OVA IgG1 concentrations from day 0 to day 90 after a single injection of vaccines (n = 5 to 19; one to four independent experiments; mean ± s.e.m.). ***p < 0.001 and ****p < 0.0001 compared to bolus, #p < 0.05, ##p < 0.005 compared to 1:5, determined by mixed-effects analysis with Tukey’s post hoc test. Serum anti-OVA (c) IgG end point titer, (d) IgG1 concentration, (e) IgG2b concentration, and (f) IgG2c concentration 15 days after bolus boost on day 90 for animals receiving either bolus, 1:5 gel, or 2:10 gel vaccines (n = 4 to 5; mean ± s.d.). Reported p values determined by one-way ANOVA with Tukey’s post hoc test. (g) Model comparing competitive binding data with KD ranging from 1 to 104 nM. (h) Representative competitive binding curves for bolus, 1:5 gel, and 2:10 gel vaccine groups after the day 90 boost compared to an mAb reference competing with the same mAb. (i) Calculated KD values from fitted binding curves for bolus, 1:5 gel, and 2:10 gel vaccine groups (n = 4; mean ± s.d.). p values determined by one-way ANOVA with Tukey’s post hoc test.
