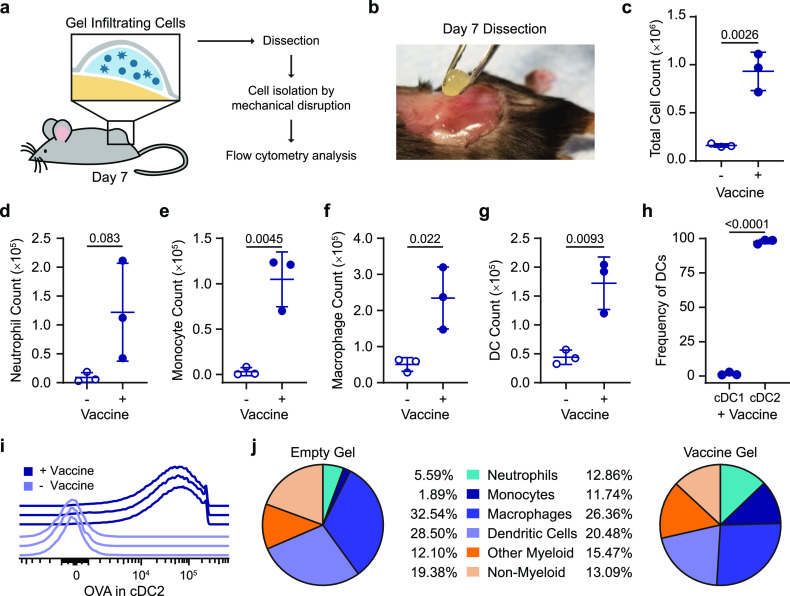
Figure 4.
Characterization of the local inflammatory niche. (a) Schematic of the inflammatory niche within the gel depot and an experimental flowchart. (b) Picture of surgical removal of 2:10 gel after 7 days in vivo. (c) Total cells in 2:10 gel with or without vaccine (OVA + Poly(I:C)) were quantified using flow cytometry. (d–g) Total count of neutrophils (d), monocytes (e), macrophages (f), and dendritic cells (DCs) (g) found in the empty and vaccine-loaded 2:10 gels. (h) The frequency of cDC1 (XCR1hiCD11blo) and cDC2 (XCR1loCD11bhi) of the total DCs in the vaccine-loaded 2:10 gel. (i) Histogram of the Alexa-647–OVA signal in cDC2s from individual mice with and without the vaccine. (j) The frequency of neutrophils, monocytes, macrophages, DCs, other myeloid cells, and nonmyeloid cells within the CD45+ cell populations found in the empty and vaccine-loaded 2:10 gels. For (c–j), n = 3 mice. All error bars are mean ± s.d.; p values are determined by a two-tailed t test.

