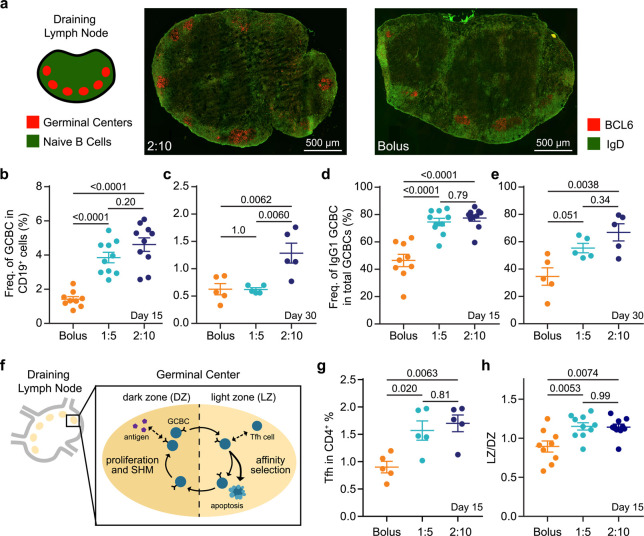
Figure 5.
Germinal center response to single vaccine administration. (a) Immunohistochemistry (IHC) of explanted inguinal lymph node 15 days after OVA + Poly(I:C) vaccine administration in 2:10 and bolus groups to visualize germinal centers (GC) (red) and naïve B cells (green). (b,c) The frequency of germinal center B cells (GCBCs) within total B cells at day 15 (b) and day 30 (c) after prime and (d,e) frequency of IgG1 + GCBCs within total GCBCs at day 15 (d) and day 30 (e) after prime in the inguinal lymph nodes were measured by flow cytometry (n = 5 to 10). (f) Schematic of the GC response. (g) The percent of T follicular helper cells (Tfh) out of the CD4+ cell population and (h) and the ratio of lights zone (LZ) to dark zone (DZ) GCBCs in the inguinal lymph nodes at day 15 after vaccinatation (n = 5 to 10). For (b,d,h), data come from two independent experiments, and all other graphs represent one independent experiment. All error bars are mean ± s.d.; p values are determined by one-way ANOVA with Tukey’s post hoc test.

