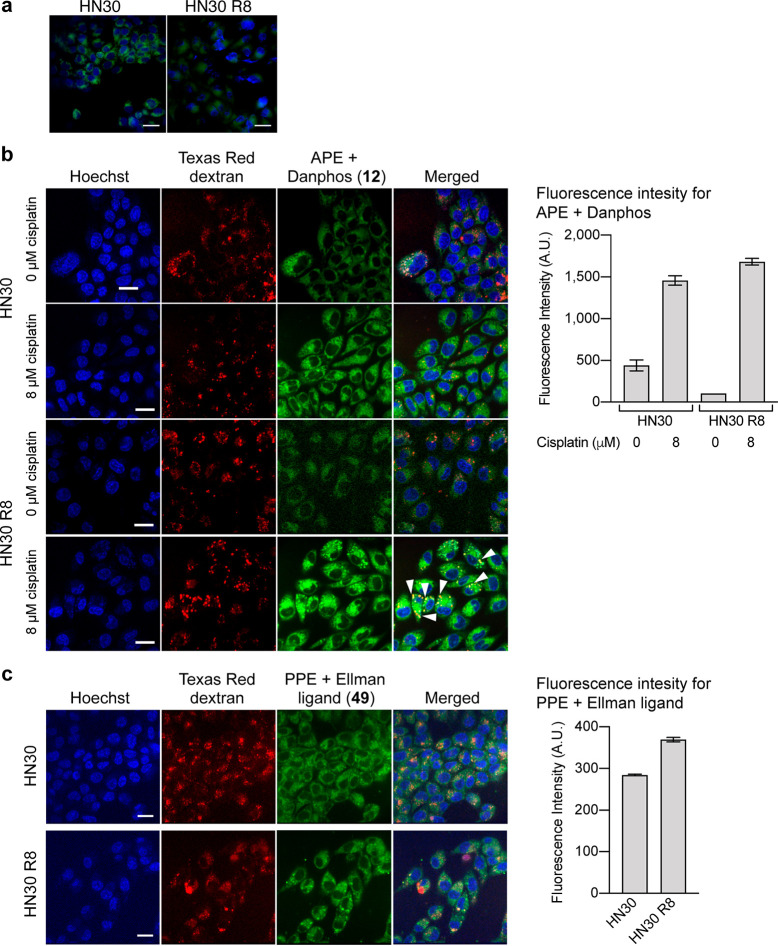
Figure 10.
(a) Widefield fluorescence images of cisplatin-treated HN30 and HN30 R8 cells. For statistical analysis, n = 5 (5 stage positions, with 50–70 cells per image). (b) Confocal fluorescence images of platinum in HN30 and HN30 R8 cells and mean pixel intensity of HN30 and HN30 R8 cells treated with 0 or 8 μM cisplatin. (c) Confocal fluorescence images of copper in HN30 and HN30 R8 cells and mean pixel intensity of HN30 and HN30 R8 cells. For (b) and (c), cells were stained with Hoechst 33342 and 10 kDa Texas Red dextran and loaded with APE and Danphos for platinum imaging or PPE and Ellman ligand for copper imaging. Conditions: 0 or 8 μM cisplatin, 20 μM APE or PPE, 800 μM Danphos or 50 μM phosphine Ellman ligand, 0.1% DMSO in DMEM with penicillin/streptomycin, 30 min, 37 °C. Scale bars = 25 μm.

