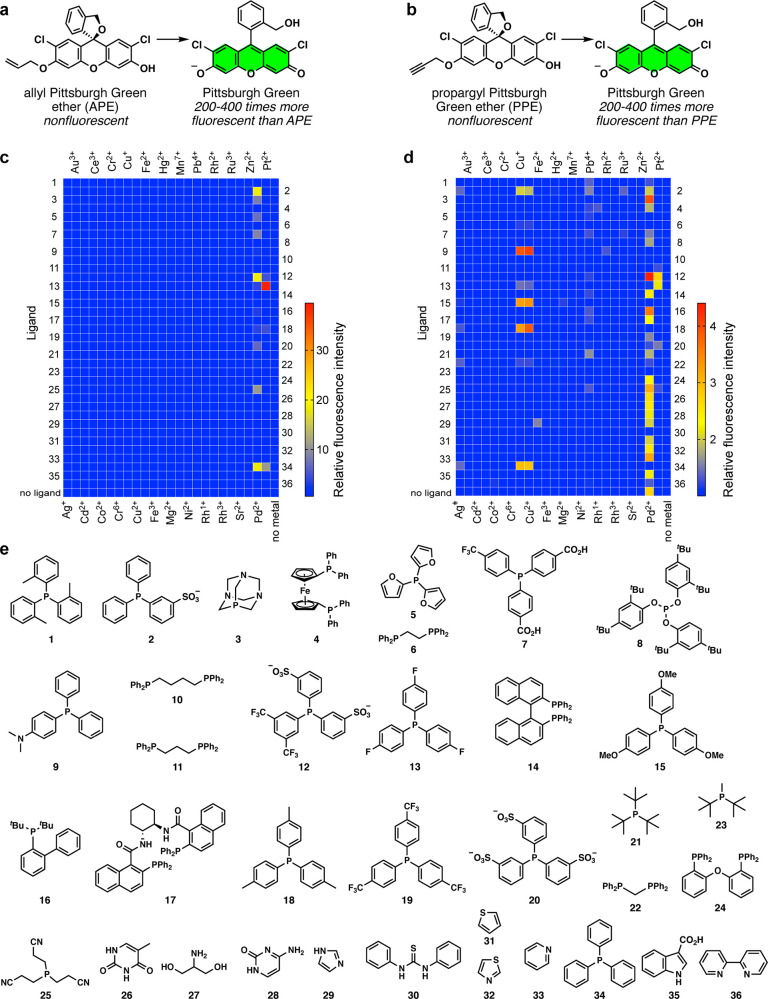
Figure 2.
(a) Fluorogenic conversion of APE to Pittsburgh Green. (b) Fluorogenic conversion of PPE to Pittsburgh Green. (c) The heat map of the metal vs ligand screening for the conversion of APE to Pittsburgh Green. (d) The heat map of the metal vs ligand screening for the conversion of PPE to Pittsburgh Green. For both heat maps, the colors indicate relative fluorescence intensities. Conditions: 1 μM metal, 20 μM APE or PPE, 200 μM ligand, 1:9 (v/v) DMSO/1.2 M phosphate buffer (pH 7.0), 25 °C, 2 h, n = 1. Row 37 contains no ligand. See Tables S1 and S2 for quantitative data. (e) Ligands used for the screenings.

