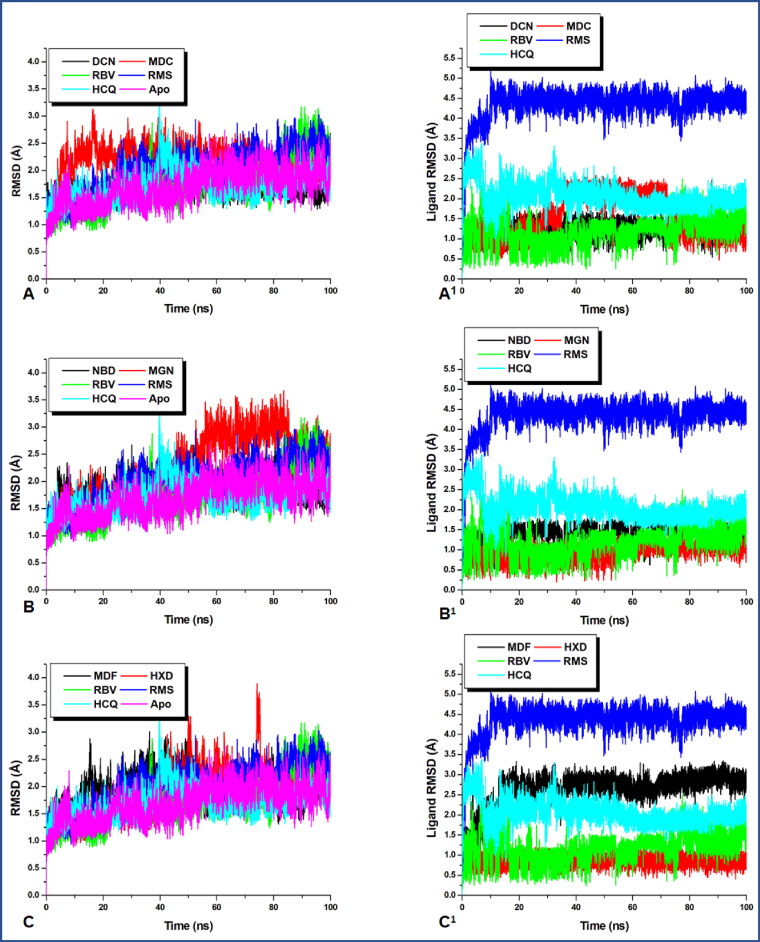
Figure 1.
A graphical representation of the evolving conformational trend at the time of the MD simulation. Although the three reference drugs were present in all the plots, the first codes in all the figure legend represent the investigated compounds. (A–C) The RMSD of the entire protein structure whereas (A1–C1) is that of the ligand, which reveals their respective momentary re-orientations during the MD run.

