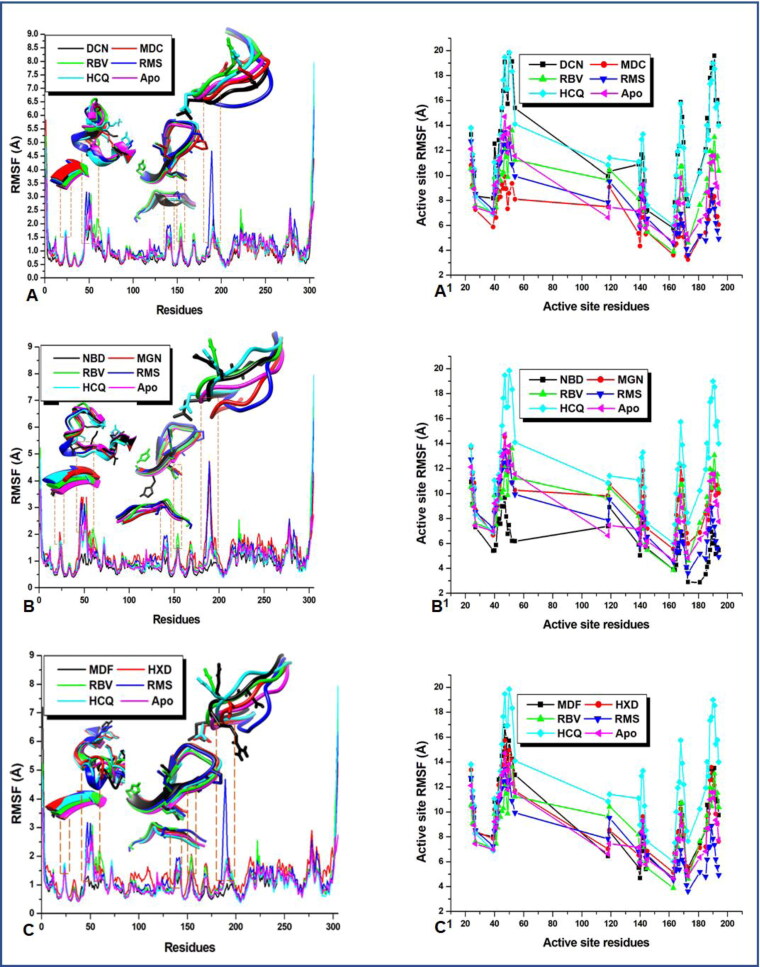
Figure 3.
A plot of per residue fluctuation; revealing regions of interest in the active sites that contributes to ligand stabilization and high-affinity binding. (A–C) The proteins whole structure with unique regions of outstanding interactions whereas (A1–C1) gives clues as to the nature/degree of active site residue fluctuations.

