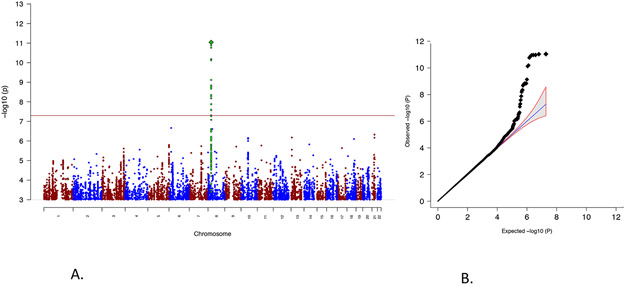
Figure 1. Genome-wide association results from the CUD GWAS results.
A) Manhattan plot of the results from the GWAS of CUD (2,387 individuals with CUD and 48,985 controls). Results are from logistic regression and P-values are two-sided. The red horizontal line indicates the threshold for genome-wide significance (P=5x10⁻⁸). The index variant is highlighted as a green diamond and SNPs in high LD with the index SNP are marked in green. B) Quantile-quantile plot of the expected and observed P-values from GWAS of CUD (2,387 individuals with CUD and 48,985 controls). The blue line indicates the distribution under the null hypothesis and the shaded area indicates the 95% confidence band.

