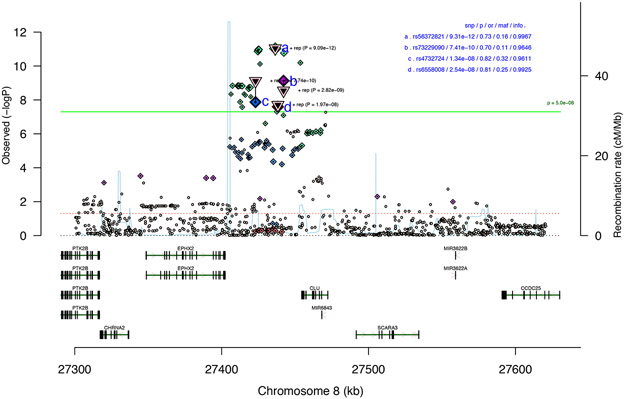
Figure 2. Association results for the geneomic region with the CUD risk locus.
Regional association plot of the local association results for the risk locus at chromosome 8 based analysis of 2,387 individuals with CUD and 48,985 controls. Results are from logistic regression and P-values are two-sided. The index variant (rs56372821) and additional three correlated genome-wide significant variants (LD with index variant: 0.2 < r2 < 0.7) are marked with letters (a-d), the triangle represents the two-sided P-value from meta-analysis (inverse variance weighted fixed effects model) with the replication cohort from deCODE (5,501 individuals with CUD and 301,041 controls). The location and orientation of the genes in the region and the local estimates of recombination rate is shown. The association P-value (p), odds ratio (or), minor allele frequency (maf) and imputation info-score (info) is presented in upper right corner. The horizontal green line represents the threshold for genome-wide significant (P=5x10⁻⁸).

