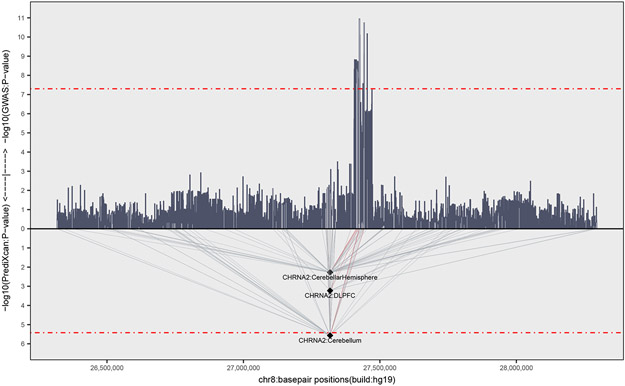
Figure 3. Association of CHRNA2 expression with CUD.
Association of the imputed genetically regulated expression of CHRNA2 with CUD in three brain tissues with a valid model (cerebellar hemisphere, dorsolateret prefrontal contex and cerebellum). The two-side P-value from logistic regression for the association of gene expression with CUD (−log10(PrediXcan:P-value) and two-side P-value from logistic regression from the CUD GWAS (−log10(GWAS:P-value)) is given on the y-axis, with a red dotted line indicating statistical significance. Both analyses include 2,387 individuals with CUD and 48,985 controls. Chromosome position is given on the x-axis and the light grey lines indicate which SNPs that are included in the models used to predict gene expression. The thin red lines indicate genetic predictors that are genome-wide significantly associated with CUD.

