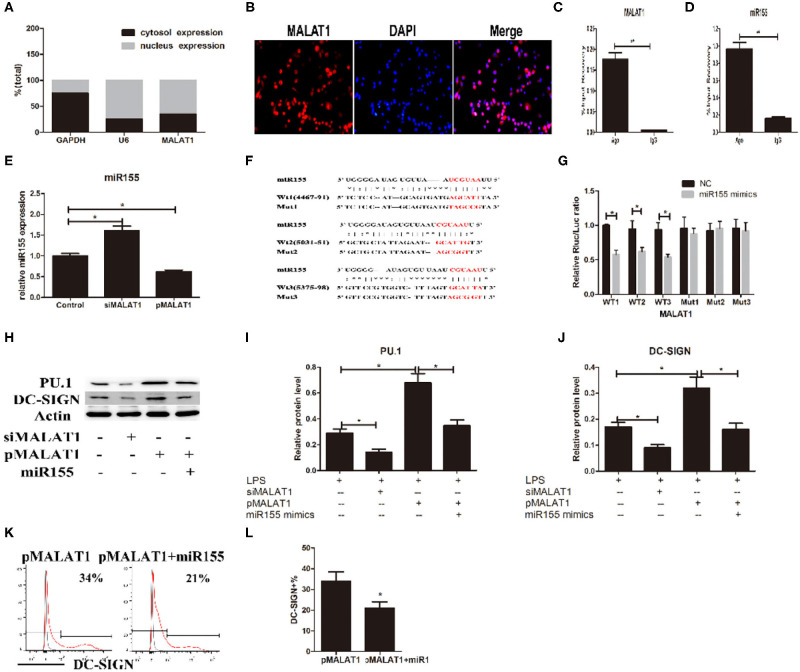
Figure 5.
MALAT1 promotes dendritic cell-specific intercellular adhesion molecule-3 grabbing nonintegrin (DC-SIGN) expression by functioning as an miR155-5p sponge. (A) MALAT1 expression levels were measured by quantitative real-time reverse transcription PCR (qRT-PCR) in nuclear and cytosolic extracts of LPS-stimulated dendritic cells (DCs). The cytosol and nuclear markers used were GAPDH and U6. (B) RNA-FISH was performed to detect MALAT1 expression in LPS-stimulated DCs. Nuclei, blue; MALAT1, red. MALAT1 was in both the nucleus and cytoplasm of DCs. (C,D) Total cellular fractions were isolated from LPS-stimulated DCs and immunoprecipitated using Ago2 or IgG antibodies in RNA immunoprecipitation assays. MALAT1 and miR155 levels in the immunoprecipitated complex were detected by qRT-PCR. Significant enrichment of MALAT1 was observed in Ago2 immunoprecipitates compared with that in IgG control immunoprecipitates. miR155 was observed in Ago2 immunoprecipitates and compared with that in IgG control immunoprecipitates. (E) The miR155 levels were detected by qRT-PCR in DCs transfected with siMALAT1 or pMALAT1 before LPS stimulation. miR-155 was upregulated in the shMALAT1-treated DCs. (F) Schematic illustration of the three miR-155 targeting sites on the MALAT1 gene, WT1(4467–91), WT2(5031–51), and WT3(5375–98). The created mutations (Mut1, Mut2, and Mut3) are shown corresponding to each wild-type (WT), respectively. (G) Luciferase reporters containing one of three WT or one of three corresponding mutant putative miR155 binding sites in MALAT1 were constructed. DCs were infected with or without miR-155 mimics and then transfected with luciferase constructs of WT1, WT2, WT3, Mut1, Mut2, or Mut3, respectively. Luciferase activity was analyzed 48 h after transfection. (H–J) DCs were transfected with siMALAT1, pMALAT1, or the combination of pMALAT1 and miR155 mimics before LPS stimulation. PU.1 and DC-SIGN protein levels were detected by western blot (H). MALAT1 knockdown significantly decreased PU.1 and DC-SIGN levels in DCs, and MALAT1 overexpression significantly increased PU.1 and DC-SIGN levels compared with those in the control group. Treatment with miR155 mimics partially abolished the effects of MALAT1 on PU.1 and DC-SIGN levels. (K,L) DCs were transfected with pMALAT1 or the combination of pMALAT1 and miR155 mimics before LPS stimulation, and DC-SIGN expression levels in DCs were also assessed by flow cytometry (K) and shown as percentages (L). The data are presented as the mean ± SD from at least three independent experiments. *P < 0.05; **P < 0.01.

