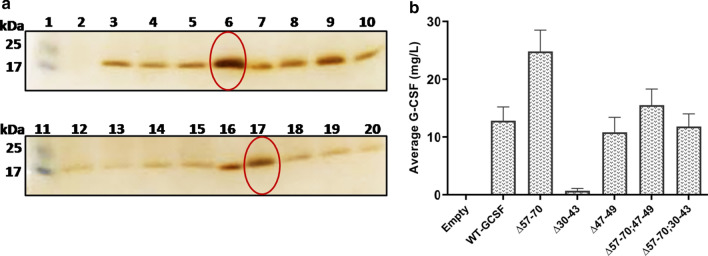
Fig. 3.
a SDS-PAGE analysis of extracellular G-CSF produced in BMMY medium by the truncated Matα fused to the WT-GCSF gene. Equal volume (25 μl) of the culture filtrate was loaded after 72 h of cultivation in a 48-well plate. Representative image of Matα:Δ57–70 transformants is shown. Lanes 1 & 11: Mol wt markers; Lane 2: empty vector; Lanes 3, 4, 5, 6, 8, 9, 10: Cl #s 3 to 9; Lane 12: Matα:WT; Lanes 13, 14, 15, 17, 18, 19, 20: Cl #s 13 to 19; Lanes 7 & 16: Standard Filgrastim (2.0 μg & 2.5 μg respectively) b Average extracellular G-CSF (mg/L) production from 14/15 clones of each category at microplate level 72 h post-methanol induction

