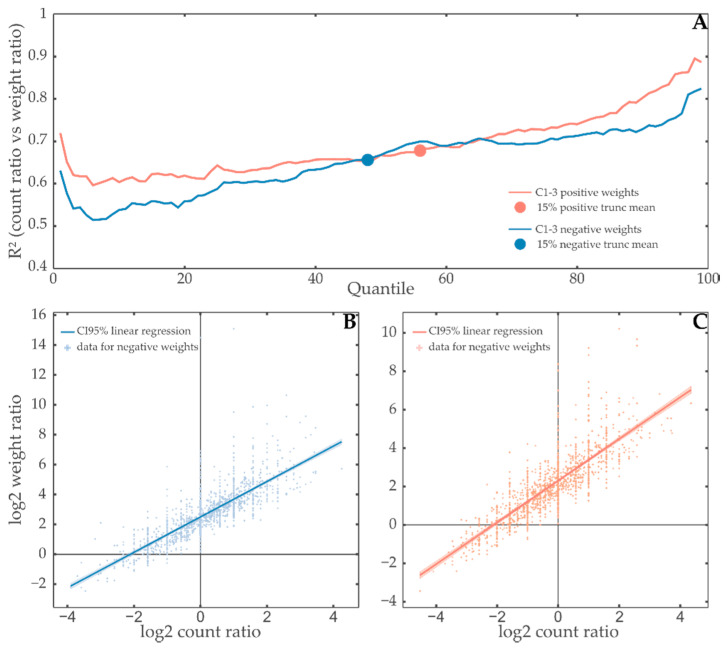
Figure 2.
Contribution weights in constraints carry information beyond the count of extreme values. (A) R2 as a measure of linear regression quality of weight sum ratio (WR) by count ratio (CR) is shown in dependence of the quantile used to split the weight distributions of annotated sets to generate these ratios in either all positive (red) or all negative (blue) weight distributions for annotated subsets of constraints 1–3. The ±15% truncated mean of each is shown as a point of the same color. The quantile that separates weights in constraints 1–3 so that it produces the 15% truncated mean R2 regression quality shown in the upper part of the figure was used to split the weights in positively (56% quantile, (C)) and negatively (48% quantile, (B)) contributing parts of annotated subsets of constraints 1–3. Subsequently, both WR and CR were calculated for all the annotated subsets in the dataset. These values are shown as either red (right) or blue (left) points on the scatter plots. Linear regression was performed, and the resulting line was plotted with a 95% confidence band. These plots correspond to the regressions for a single y-value on the top plot. The existence and increase of outliers in the high weight/count ratio region suggests that high weight items carry an especially large amount of information that is lost when using traditional methods.

