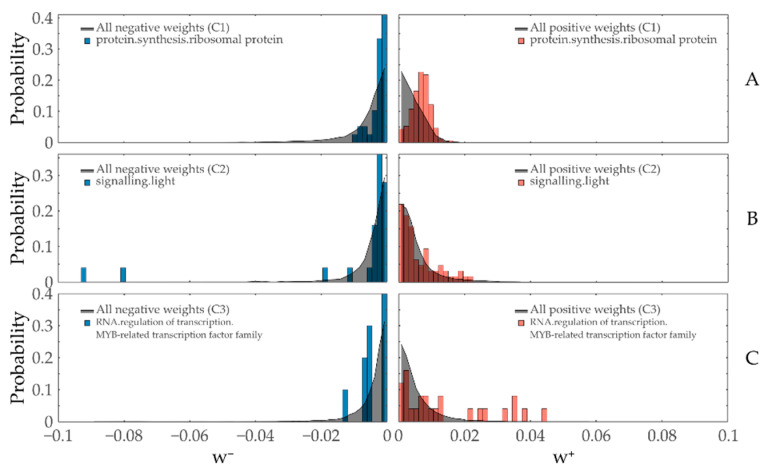
Figure 3.
TMEA reports different weight distribution shapes for annotated subsets as significant. Histograms with a bin width of 0.0015 of both negatively (left part of the plots, blue) and positively (right part of the plots, red) contributing entities in the functionally annotated sets of (A) protein.synthesis.ribosomal protein for Constraint 1, (B) signaling.light for Constraint 2, and (C) RNA.regulation of transcription.MYB-related transcription factor family protein for Constraint 3 are plotted together with the respective overall distribution of weights (gray area plot) of the respective sign and constraint.

