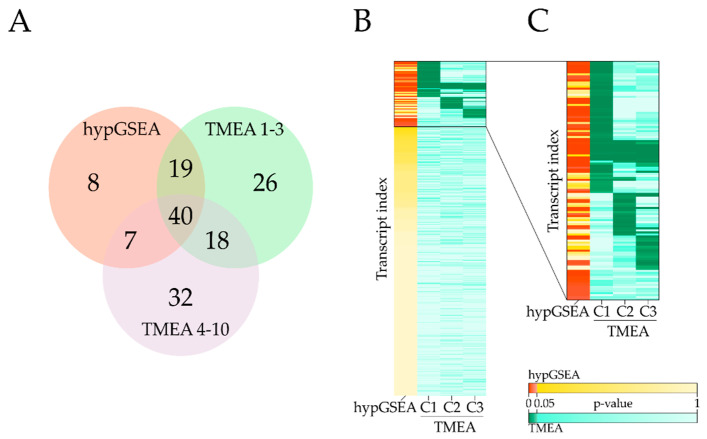
Figure 4.
Comparison of significant functionally annotated sets (FASs) obtained by hypergeometric distribution (hypGSEA) and TMEA. (A) Venn diagrams of significant FASs with a minimum size of 5 reported by hypGSEA, TMEA constraints 1–3, and TMEA constraints 4–10 for a comparison without threshold. (B) Heatmap of adjusted p-values obtained by hypGSEA and TMEA. Measured transcripts were labeled with their respective hypGSEA p-value and the minimal TMEA p-value obtained within the first three constraints. All TMEA-significant bins are clustered by k-means clustering with k = 6. (C) Visualization of all FAS reported significant by hypGSEA and/or TMEA. Detailed cluster information is given in Table A1. Bins that are not reported by TMEA are appended to the end of the heatmap with increasing hypGSEA p-values.

