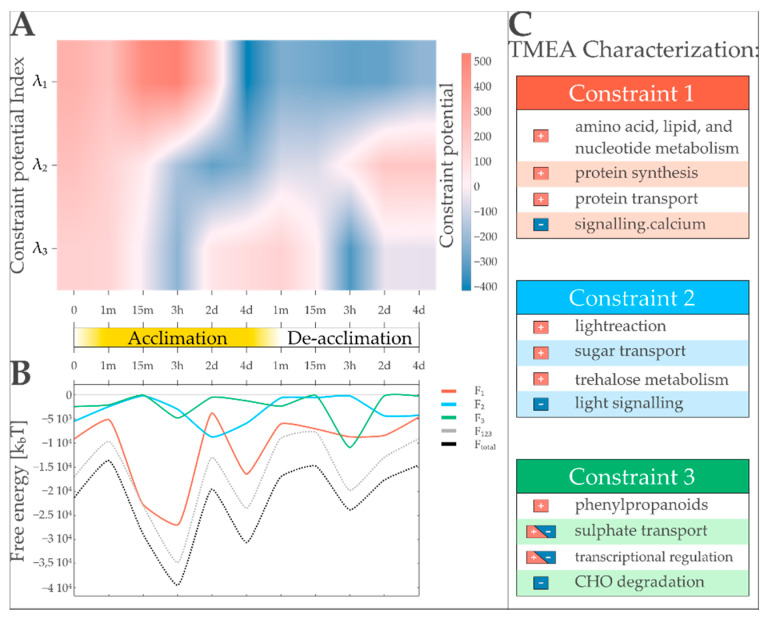
Figure 5.
TMEA and surprisal analysis identify three major transcription patterns governing high light acclimation in Arabidopsis thaliana and provide a concise functional description for them. (A) Time course of the three major constraint potentials (λα for α = 1,2,3) indicate the importance of the respective transcription pattern. The potentials of the first three constraints (λ1–λ3) are shown for four days of acclimation and four days of subsequent de-acclimation. While λ1 separates the experiment in two major phases, λ2 and λ3 show more fluctuating patterns, defining three or four states, respectively. (B) Free energy landscapes defined by the three major state variables. Energy levels are plotted for transcription patterns (F1–F3), their sum (F123), and the total free energy when using all constraints for free energy calculation (Ftotal). The dominant pattern is responsible for two of the three visible local energy minima. The least weighted pattern of the three is responsible for an energy minimum at the end of the time course. (C) Selected FASs reported by TMEA with significant influences on the respective constraints are listed. Directional influence (+ for positive, − for inverse) on the respective pattern is indicated.

