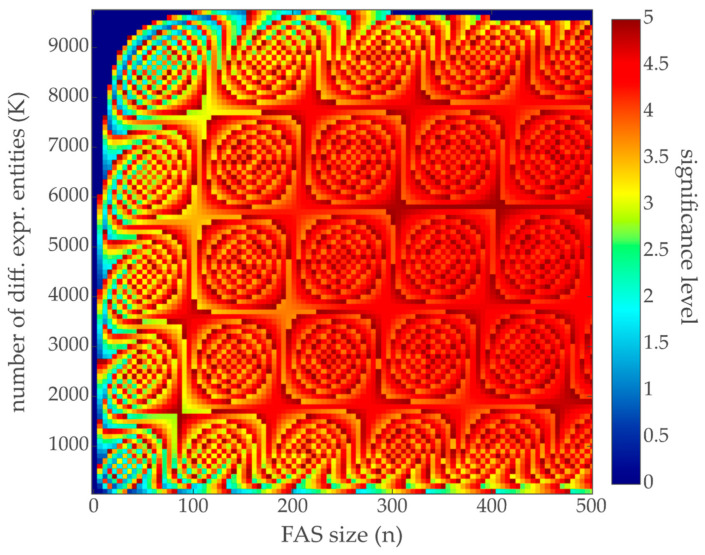
Figure A1.
Maximal reachable α-level at a given α-level of 5%. The discrete nature of the hypergeometric distribution prevents the significance to reach 0.05 exactly. There always is a range of α-level space that must be sacrificed leading to a lower α than intended. The heatmap shows the maximal reachable α-level given: N = total number of genes = 10,000; K = number of differentially expressed genes; n = bin size; k = minimal number of differentially expressed genes needed for p-value < 0.05; intended α-level = 0.05. Especially when the bin size is low, even the half of the intended α-level often cannot be reached. Note that the bin size ranges from 1 to 500 in steps of 5.

