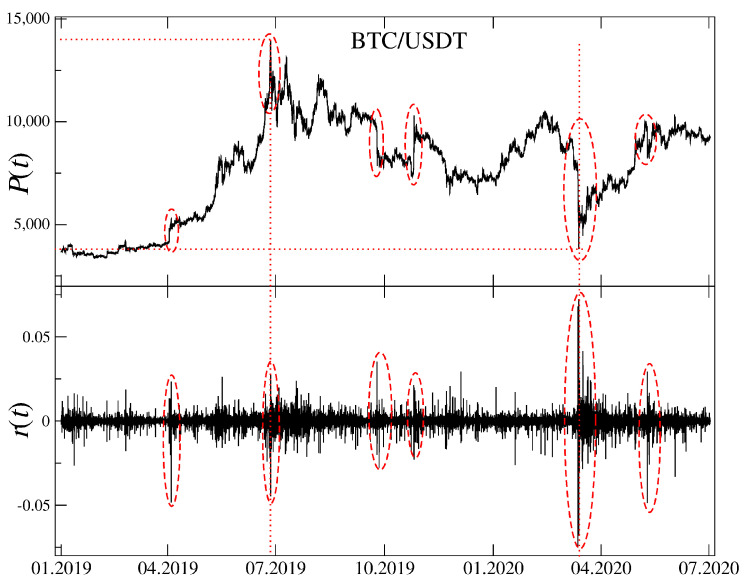
Figure 1.
Time evolution of the BTC/USDT exchange rate (top) together with the corresponding logarithmic returns (bottom). Several interesting events can be distinguished like start of a bull market in April 2019 and its end in July 2019, a sudden decrease and then an equally sudden increase in October and November 2019, the Covid-19 pandemic outbreak and related panic in March 2020 and the pandemic’s 2 wave in June 2020. Local extrema of are indicated by the vertical (time) and horizontal (price) dotted lines.

