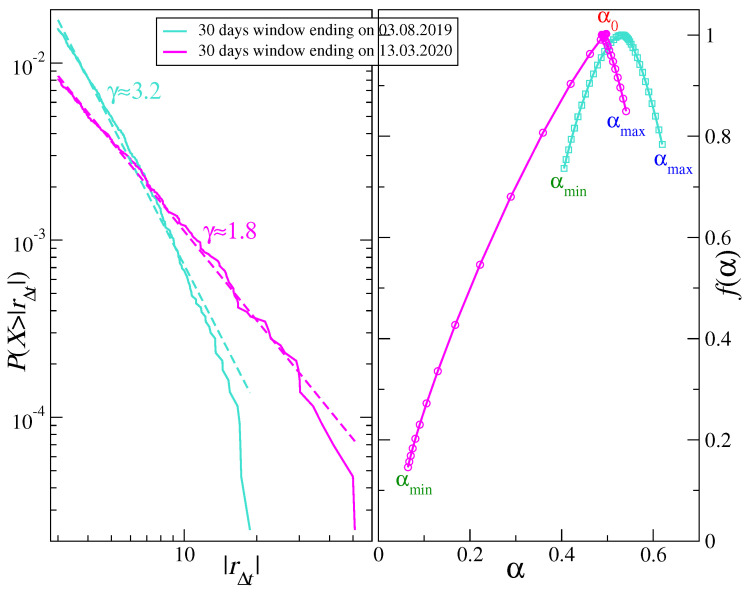
Figure 3.
(Left) Cumulative distribution function calculated in 30-day windows. Two extreme cases of power-law tail are shown with the scaling exponent (mid February–mid March 2020) and (July 2019) representing stable and unstable distributions, respectively. (Right) Singularity spectra calculated in the same windows as above. An example of asymmetric, bifractal-like spectrum (mid February - mid March 2020) and an example of symmetric spectrum (July 2019) are shown together with characteristic values of the Hölder exponent: , , and (see Equation (9) in Section 2.2).

