Figure 8.
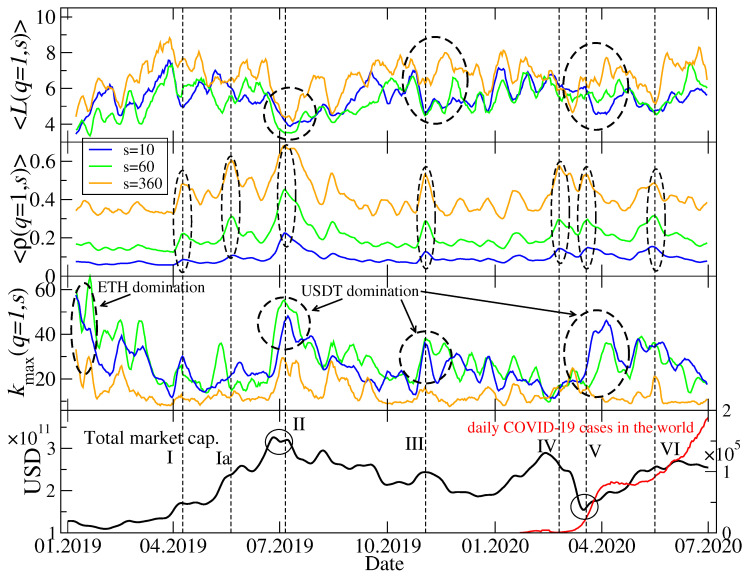
Network characteristics describing minimal spanning trees (MSTs) calculated for and for the following scales: min, min, and min. The average path length between a pair of MST nodes (top), the average q-dependent detrended cross-correlation coefficient (upper middle), the maximum node degree (lower middle), together with the total market capitalization in US dollars and the daily number of new Covid-19 cases in the world (bottom). Several events related to a relatively strong cross-correlations are marked with vertical dashed lines, Roman numerals, and dashed ellipses: Start of a bull market in April 2019 (event I) and its continuation in May 2019 (event Ia), a peak of the bull market in July 2019 (event II), a local peak followed by a sharp drop of the market capitalization in November 2019 (event III), the Covid-19 panic in mid March 2020 (events IV-V), and the 2nd Covid-19 wave from May 2020 (event VI).

