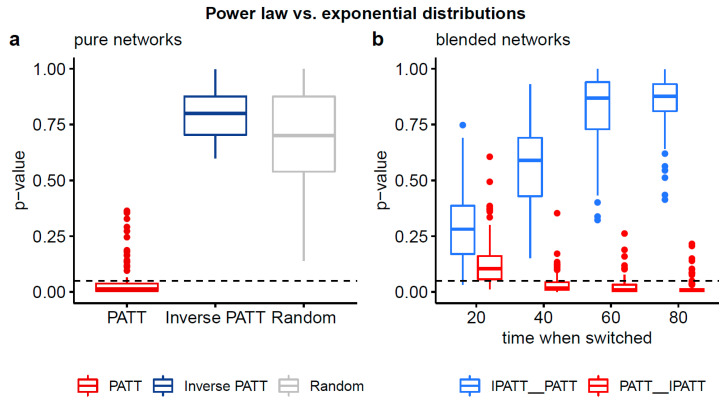
Figure 5.
Boxplots of two-sided p-values from Vuong’s test of non-nested models comparing the fits of power law and exponential distributions to the degree distributions of simulated networks. Panel (a) compares the degree distributions of pure networks and panel (b) compares the degree distributions of blended networks. Non-significant p-values (based on an alpha-level of 0.05) indicate that neither distribution is preferred. Significant p-values (based on an alpha-level of 0.05) indicate that one distribution fits the empirical data better. Based on the 1-sided p-values (see Table A1), the power law distribution provides a better fit than the exponential distribution for all networks grown by preferential attachment, except for when the switch to its inverse variant occurs early.

