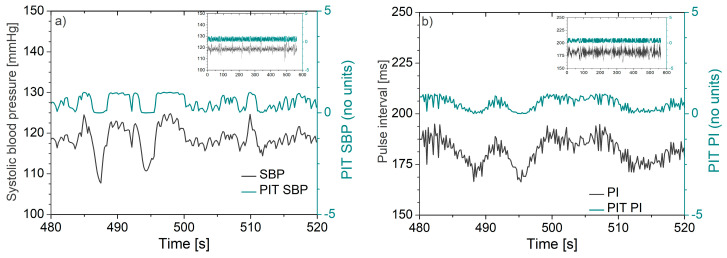
Figure 2.
Waveforms recorded from a laboratory rat before and after the probability integral transform: (a) Systolic blood pressure (SBP) and corresponding probability integral transform (PIT) signal and (b) pulse interval (PI) and corresponding PIT signal. Note that fluctuations of PIT signals follow the fluctuations of the original signals. The insets in the top right corner illustrate the uniformity of the PIT amplitudes along the entire recording time.

