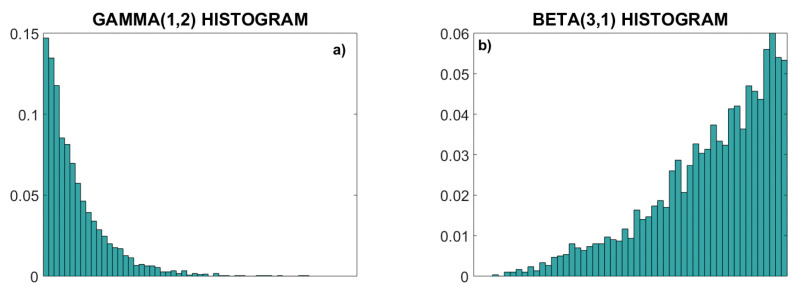
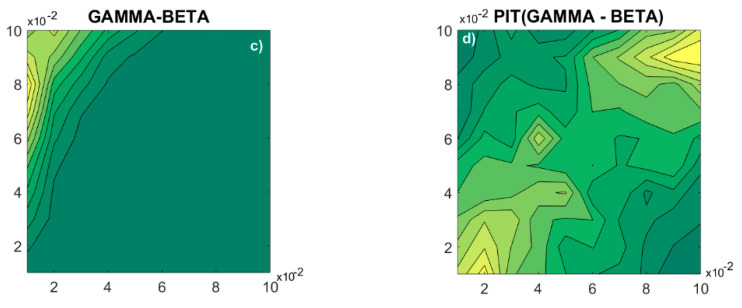
Figure 5.
Statistical properties of skewed distributions. (a) Normalized histogram (empirical PDF) of the gamma (1, 2) distribution; (b) normalized histogram of the beta (3, 1) distribution; (c) joint 2D PDF; (d) copula density. Note that the linear statistical dependency induced by the copula parameter cannot be recognized in the joint probability density function (c), but it is visible in the dependency structure of the copula density (d).


